Multiple Regression &
Fundamentals of Causal Inference
1. Introduction
Merlin Schaeffer
Department of Sociology
2024-09-03
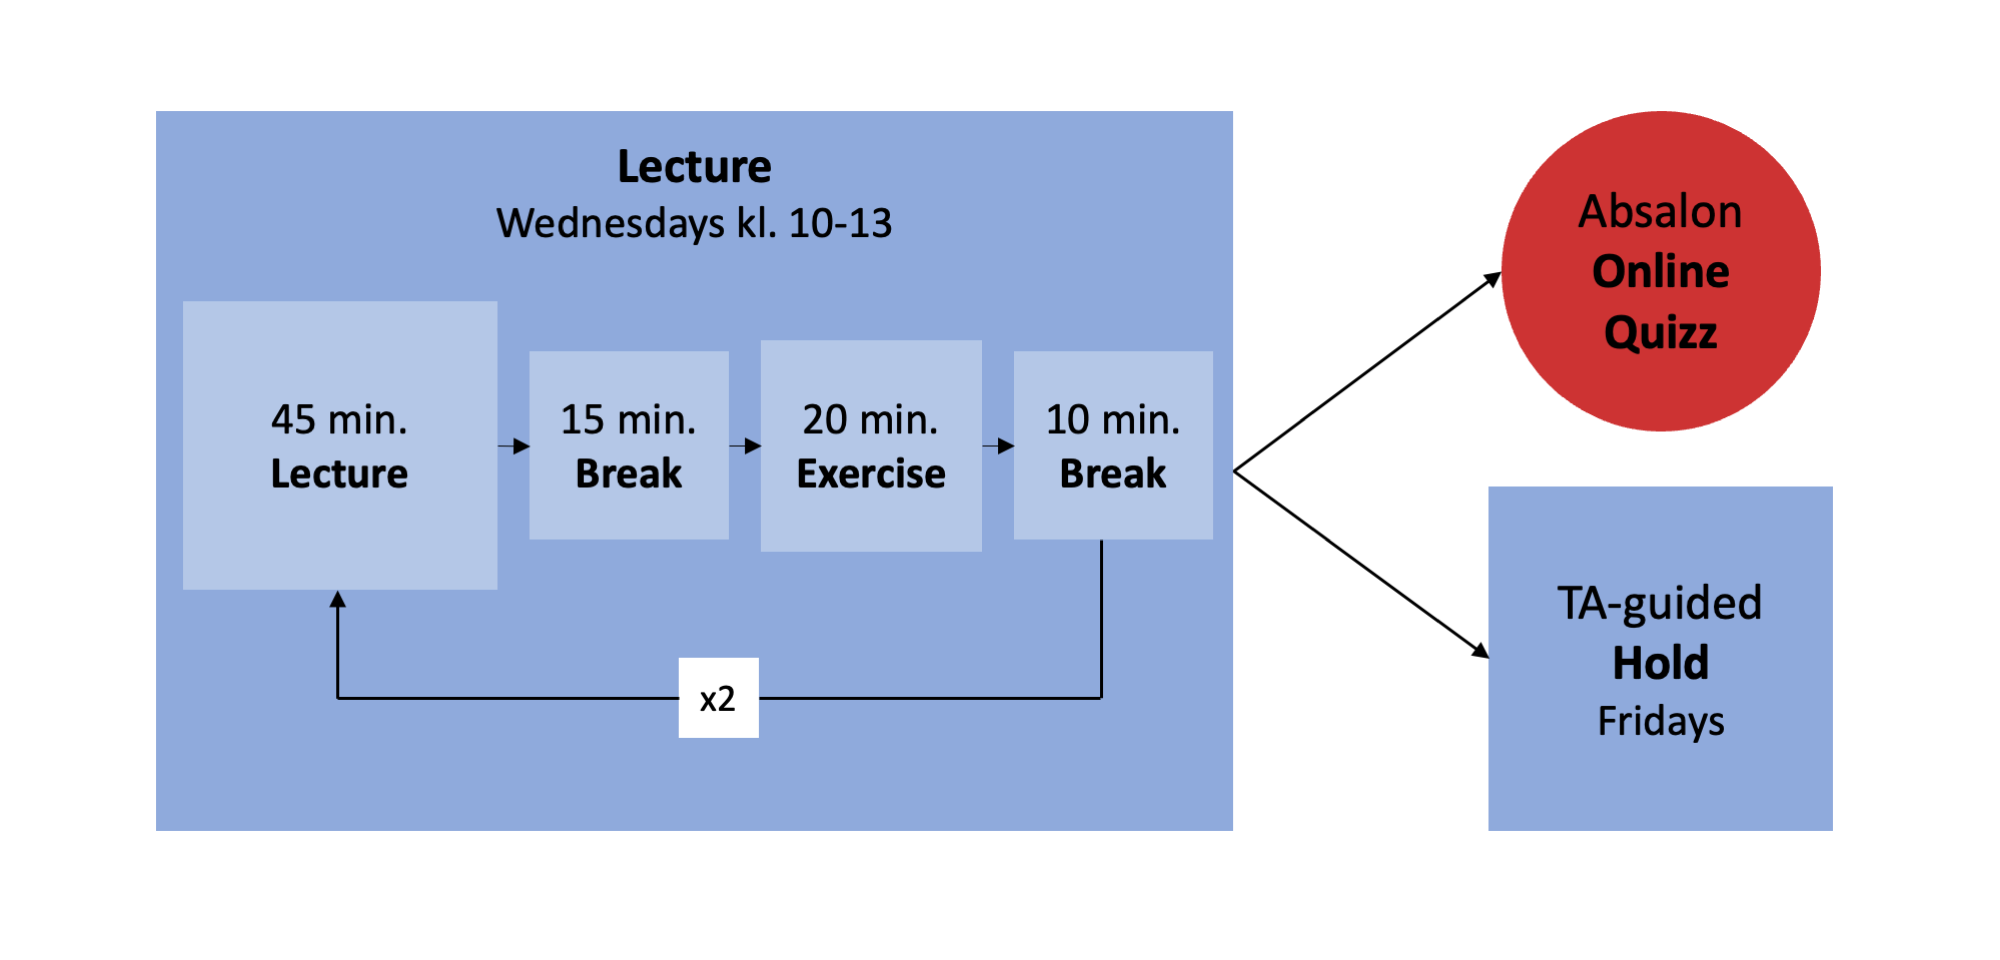
Course structure
| TA | Fridays | Room |
|---|---|---|
| Adna | 8 am | CSS 2-1-02 |
| Josefine | 8 am | CSS 4-1-30 |
| Elias | 10 am | CSS 2-2-55 |
| Jonas | 10 am | CSS 2-1-55 |
My research agenda
How Does International Immigration
Transform our Societies?
Some of my current work

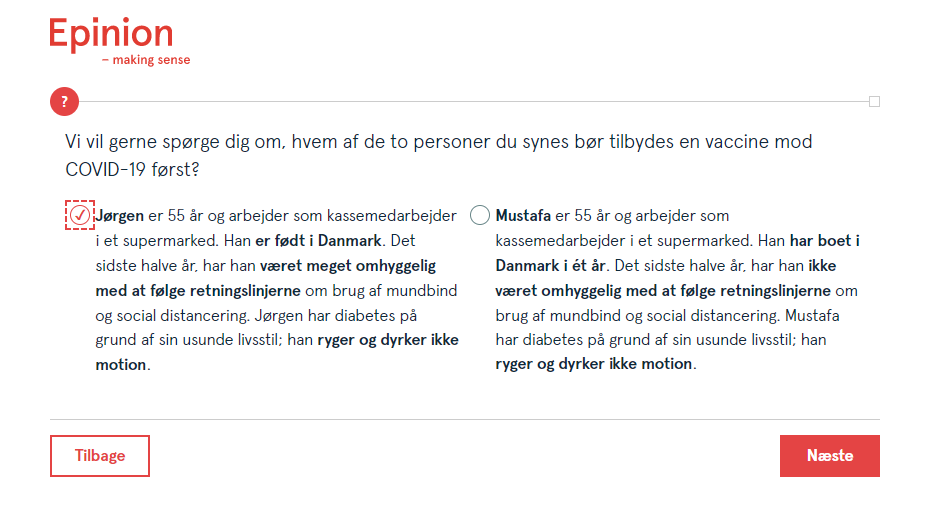 Source: Schaeffer and Haderup Larsen (2023)
Some of my current work
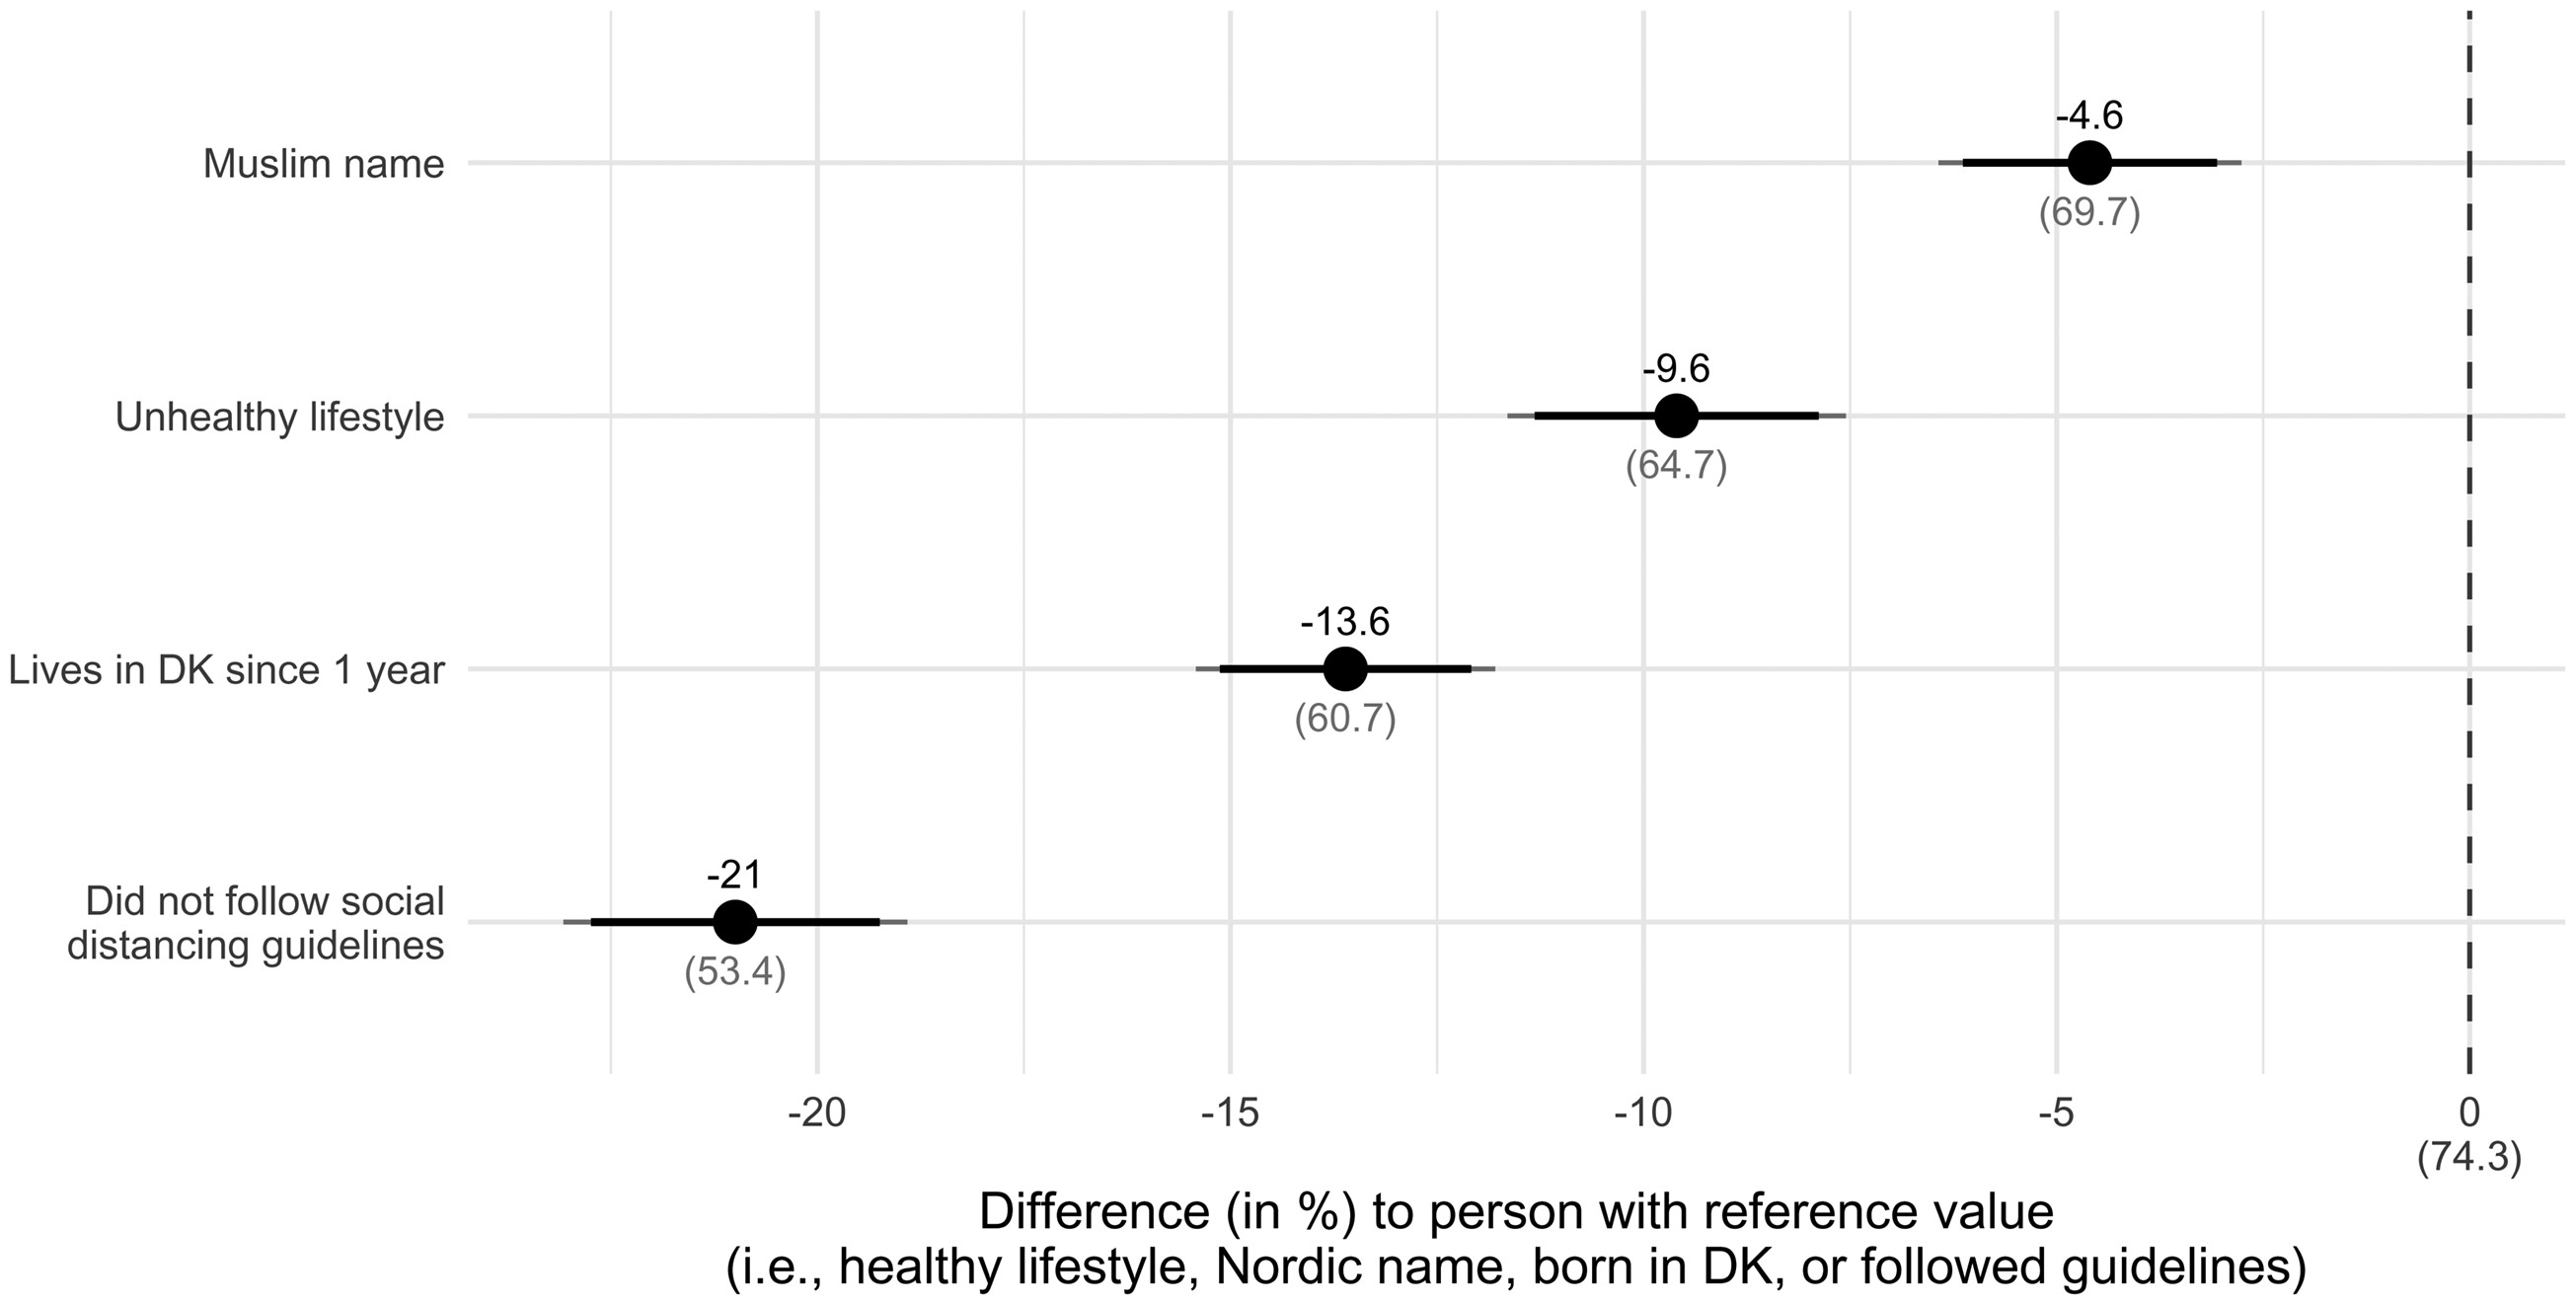 Source: Schaeffer and Haderup Larsen (2023)
Some of my current work
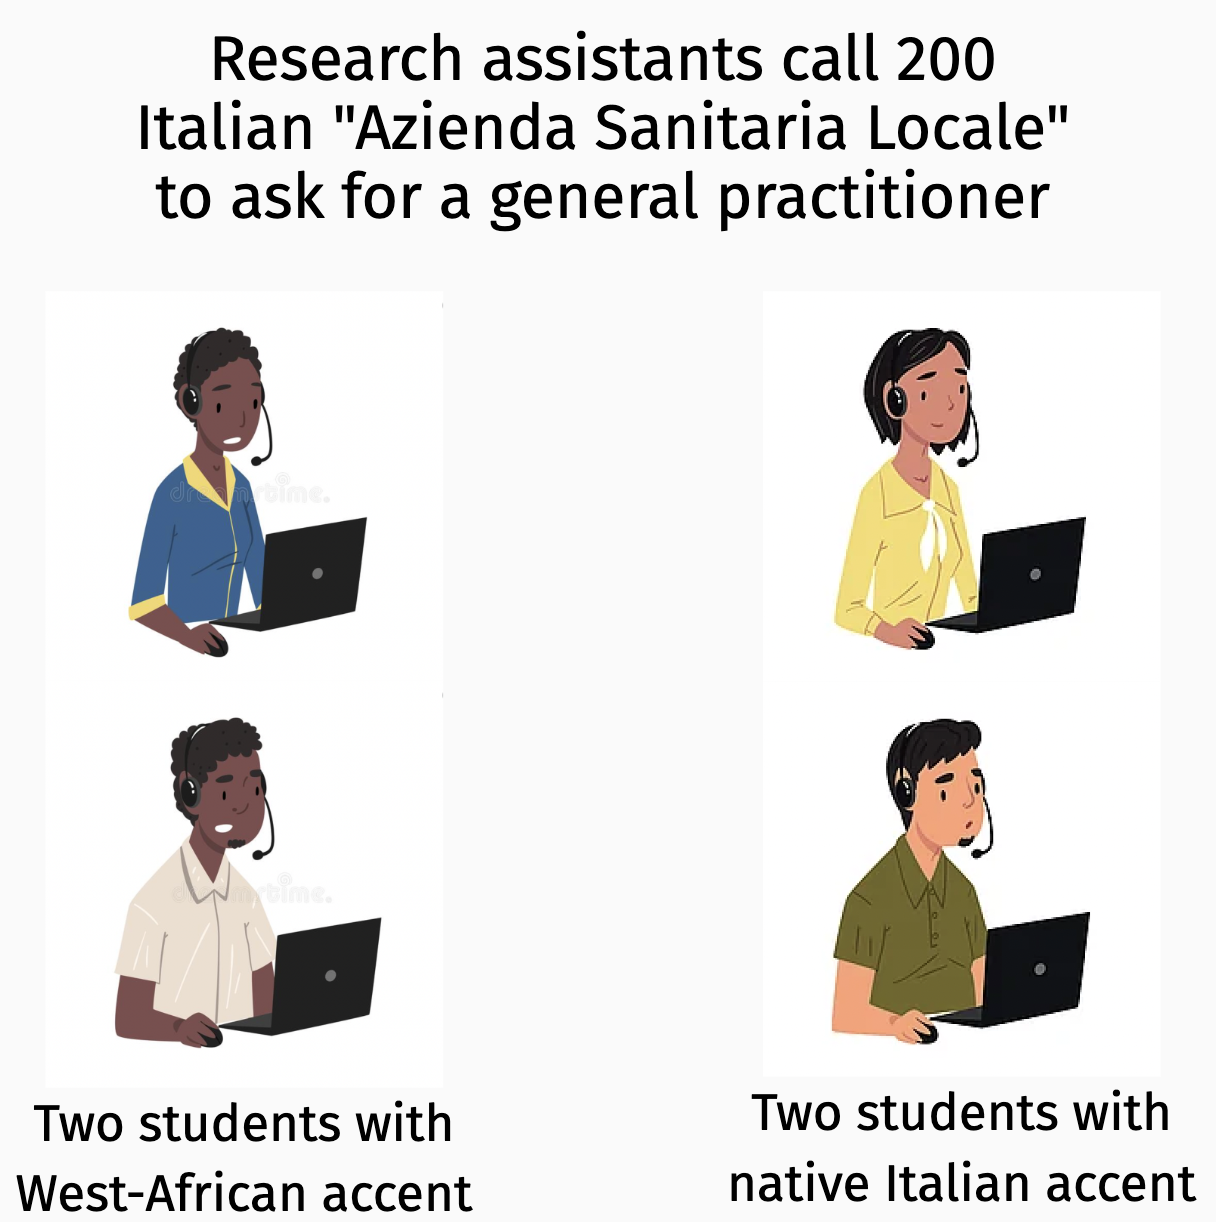 Source: Krakowski, Schaeffer, Romarri, and Rosenberg (2022)
Some of my current work
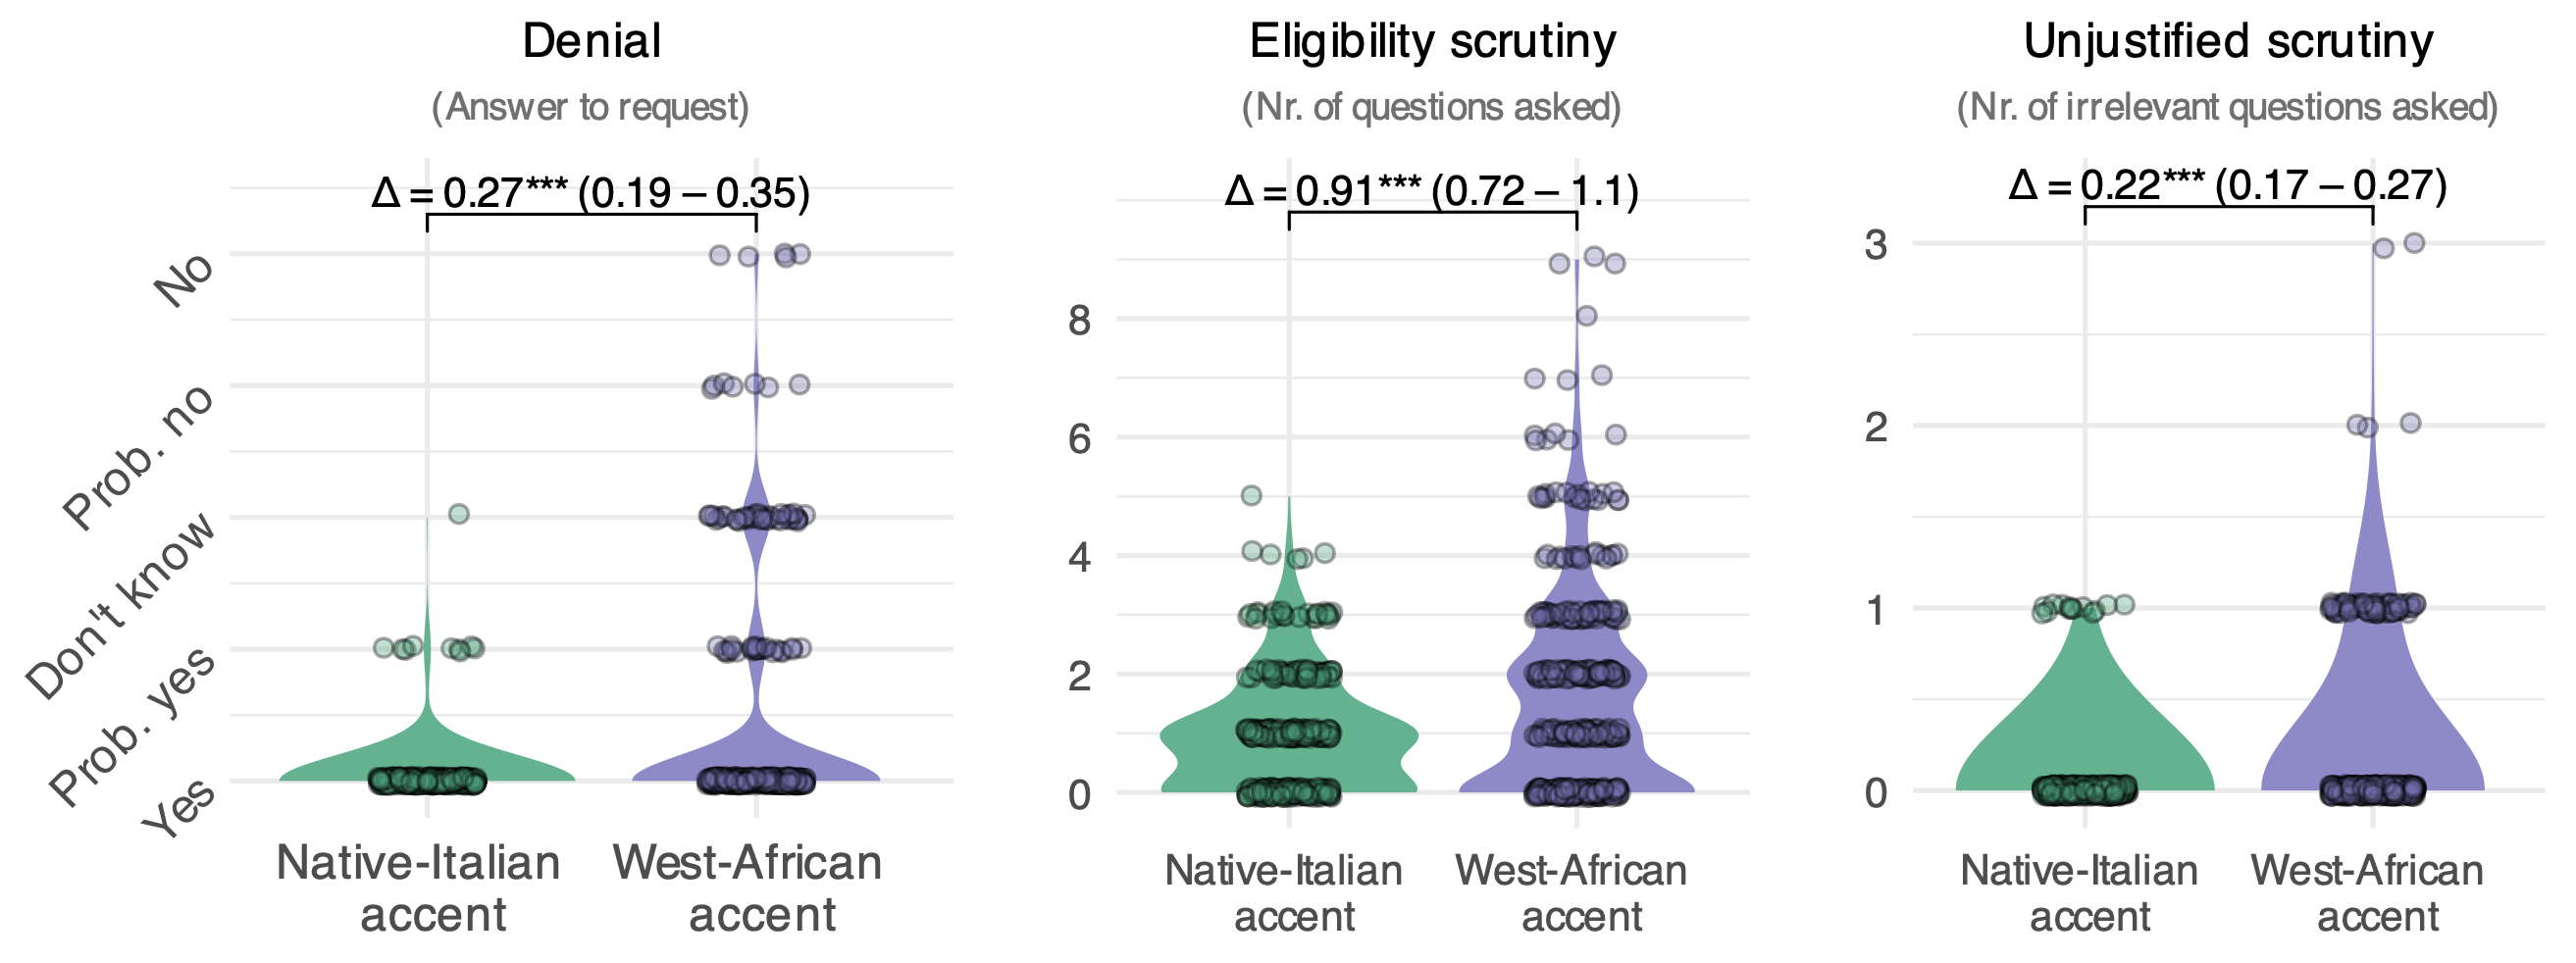 Source: Krakowski, Schaeffer, Romarri et al. (2022)
Some of my current work
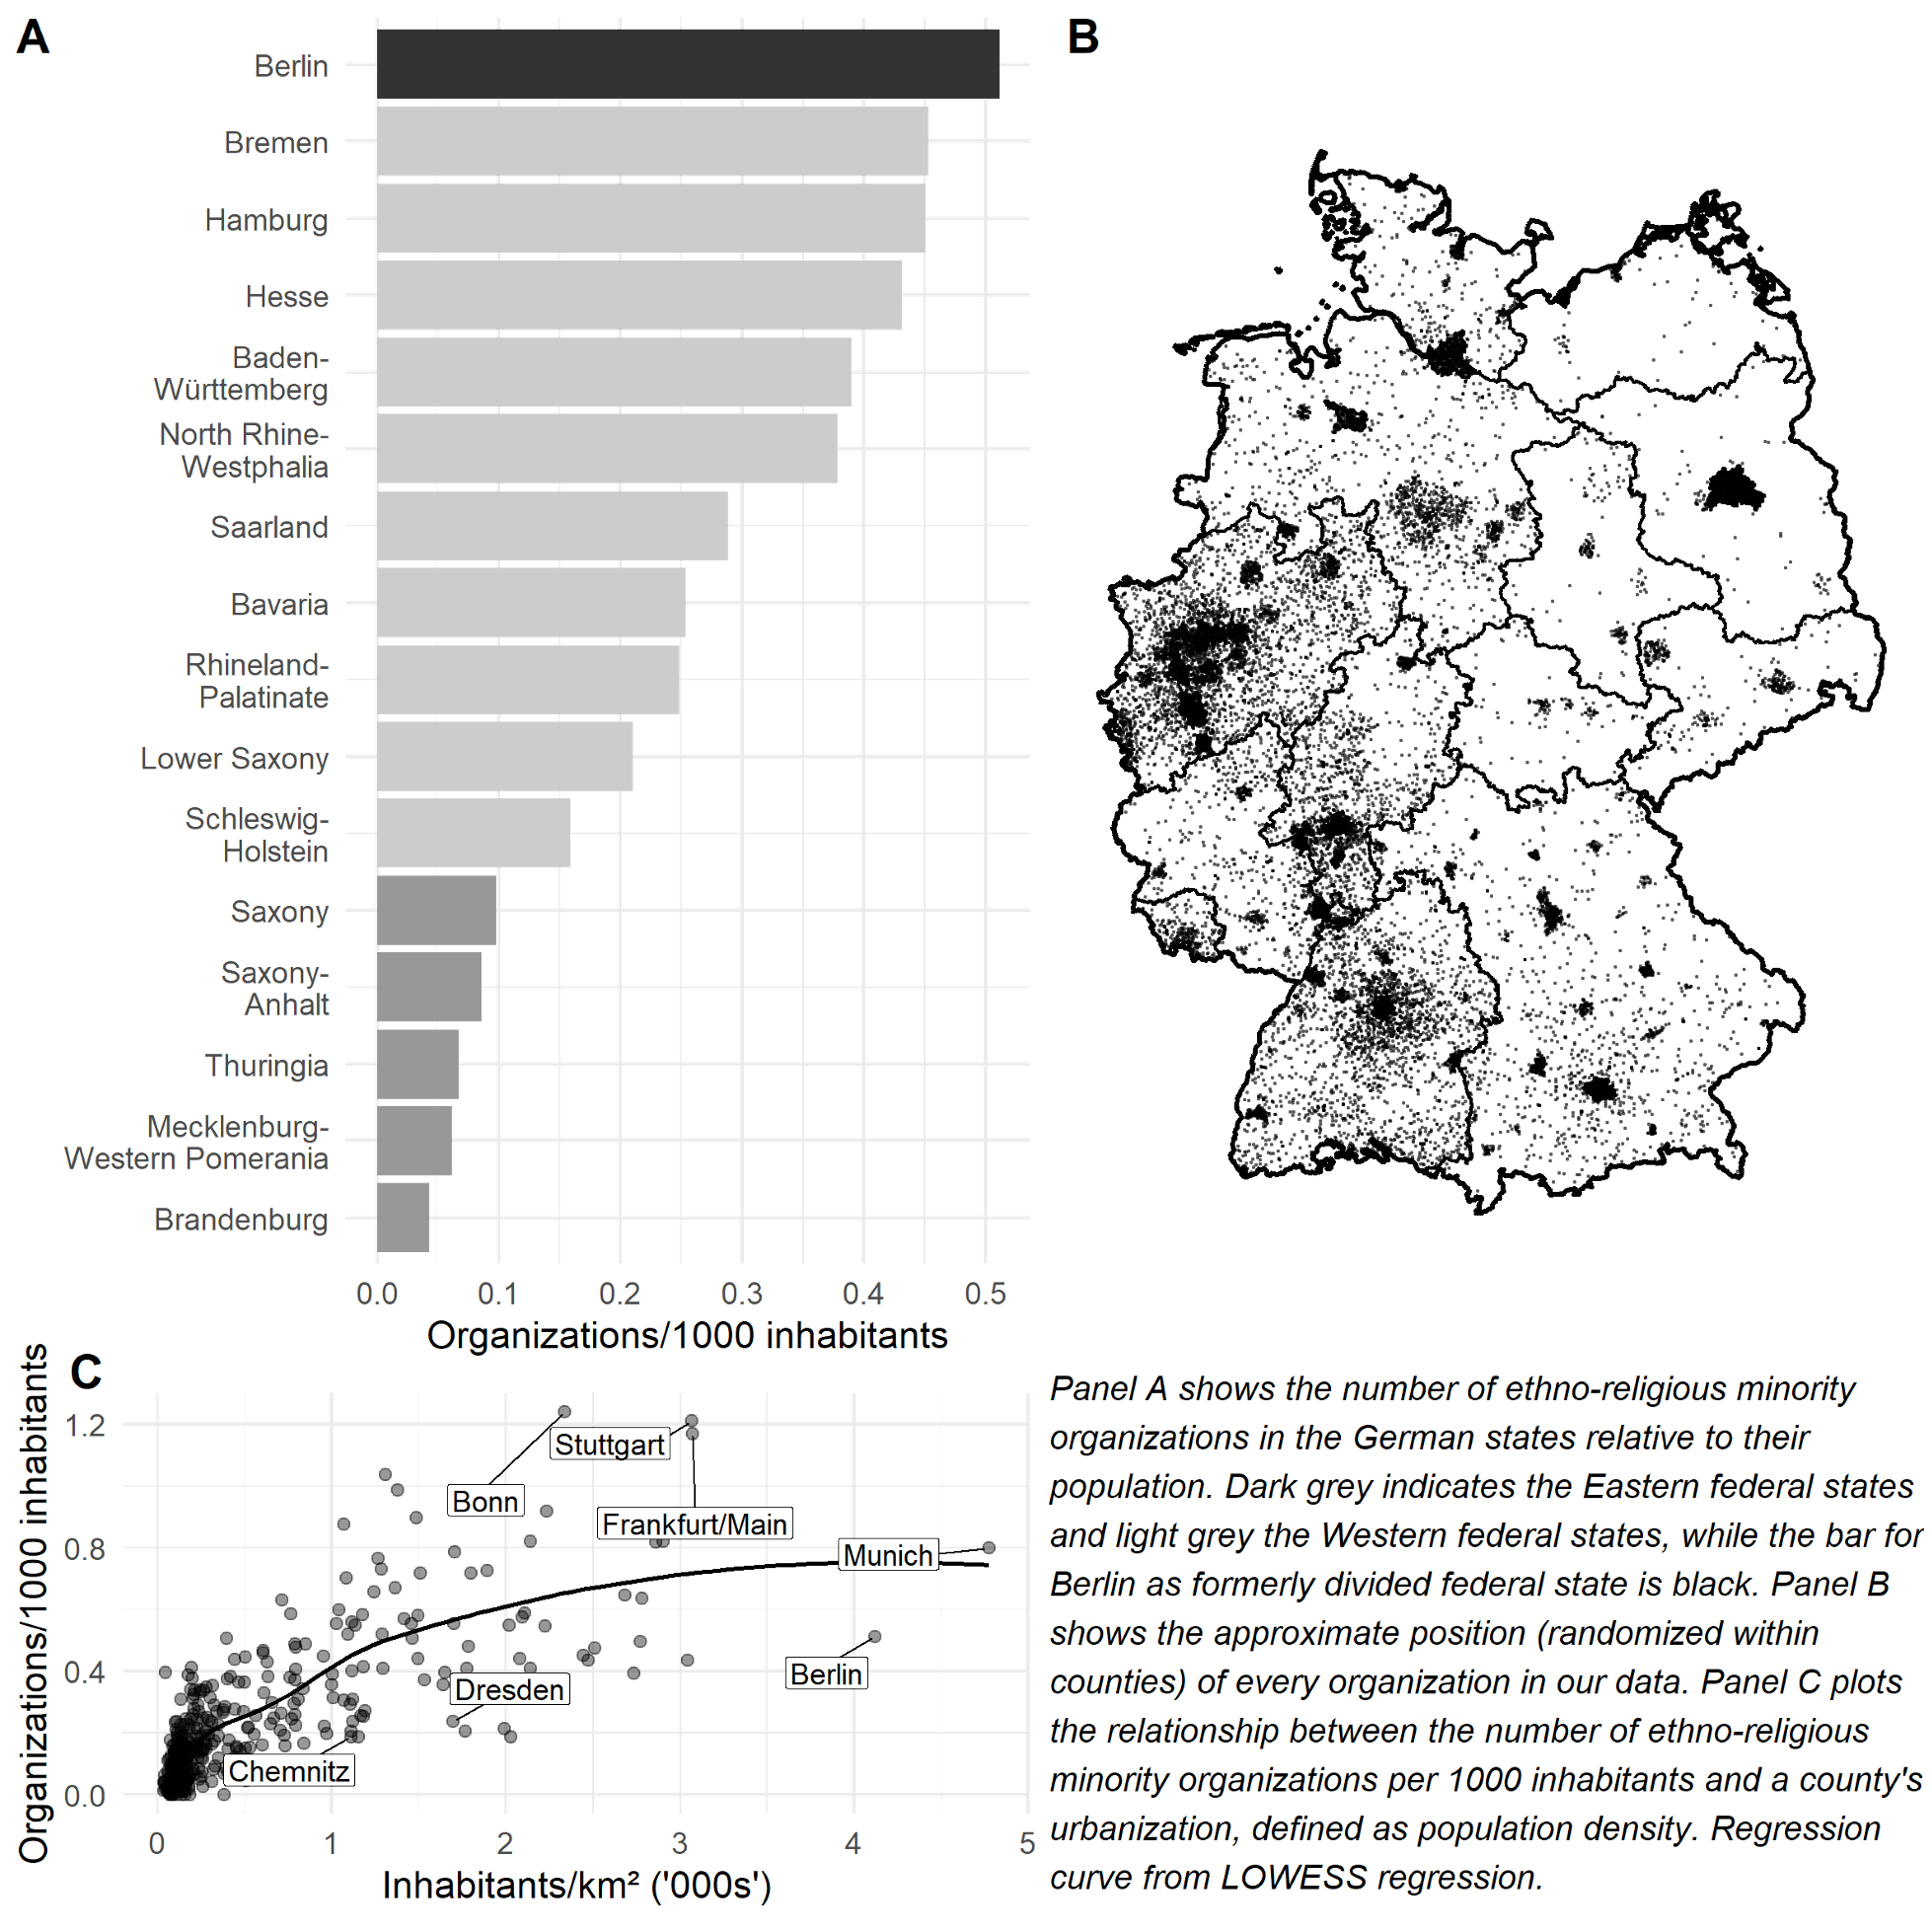 Source: Wiedner, Schaeffer, Carol, and Böller (2023)
Explanatory Sociology
4 Types of research questions
(1) Ontological: What is the nature of X?
- What is power?
- What is gender; how is it different from race?
- What is a state?
A human community that (successfully) claims the monopoly of the legitimate use of physical force within a given territory
-- Max Weber, "Politics as a Vocation" 1918
(2) Critical: Is X (un-)just?
- Is home office exploitation?
- Is the color-blind ideology a new form of racism?
(3) Descriptive: What types of X exist
and how frequent are they?
- What are the survival strategies of the poor?
- How did Danes structure their days during the COVID-19 lockdowns?
(4) Explanatory: What is the effect of X?
- What are the consequences of anomie?
Why does the suicide rate vary across societies? - How does capitalism affect us?
- How does urbanization affect us?
- Why do people obey power?
- How does a state gain legitimacy over the use of physical force?
Think of the last exam you wrote. What type of research question did it enage with?
4 Types of research questions
(1) Ontological: What is the nature of X?
- What is power?
- What is gender; how is it different from race?
- What is a state?
A human community that (successfully) claims the monopoly of the legitimate use of physical force within a given territory
-- Max Weber, "Politics as a Vocation" 1918
(2) Critical: Is X (un-)just?
- Is home office exploitation?
- Is the color-blind ideology a new form of racism?
(3) Descriptive: What types of X exist
and how frequent are they?
- What are the survival strategies of the poor?
- How did Danes structure their days during the COVID-19 lockdowns?
(4) Explanatory: What is the effect of X?
- What are the consequences of anomie?
Why does the suicide rate vary across societies? - How does capitalism affect us?
- How does urbanization affect us?
- Why do people obey power?
- How does a state gain legitimacy over the use of physical force?
Goal of empirical sociology
Use data to discover patterns,
and the social mechanisms that bring them about.

Three learning goals
Three learning goals
(1) Multiple OLS regression
- Multiple predictors & confounder adjustment,
- Interaction effects,
- Polynomials.
(2) Visualization of regression results
- Model predictions,
- Coefficient plots.
 Source: Legewie and Schaeffer (2016)
Three learning goals
(1) Multiple OLS regression
- Multiple predictors & confounder adjustment,
- Interaction effects,
- Polynomials.
(2) Visualization of regression results
- Model predictions,
- Coefficient plots.
 Source: Legewie and Schaeffer (2016)
(3) Fundamentals of causal inference
- Potential outcomes and directed acyclical graphs,
- Randomized Controlled Trials,
- Intention to treat & instrument variable regression,
- Multiple regression,
- 2-SLS instrument variable regression,
- Regression discontinuity designs.
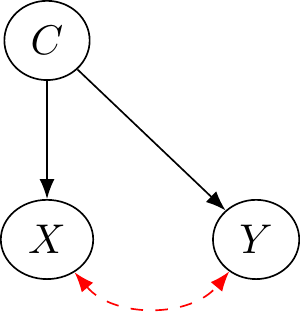
Example: Regression discontinuity design


Example: Regression discontinuity design

Municipalities where far-right candidates
ran
versus where they won
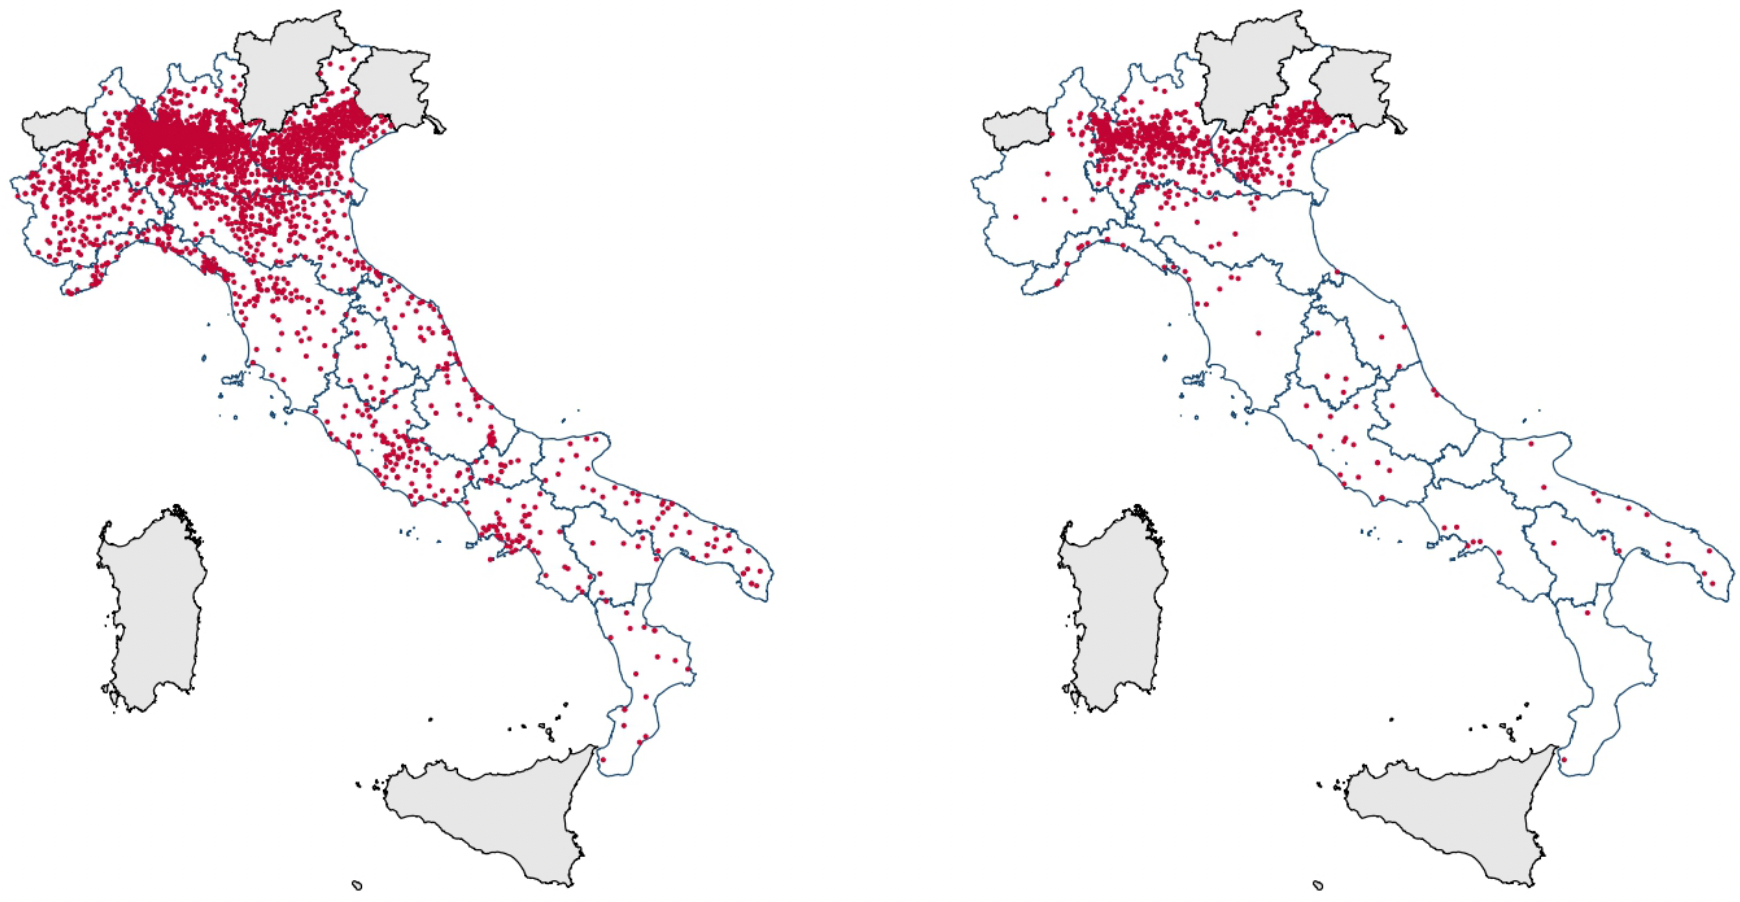 Source: Romarri (2020)
Example: Regression discontinuity design
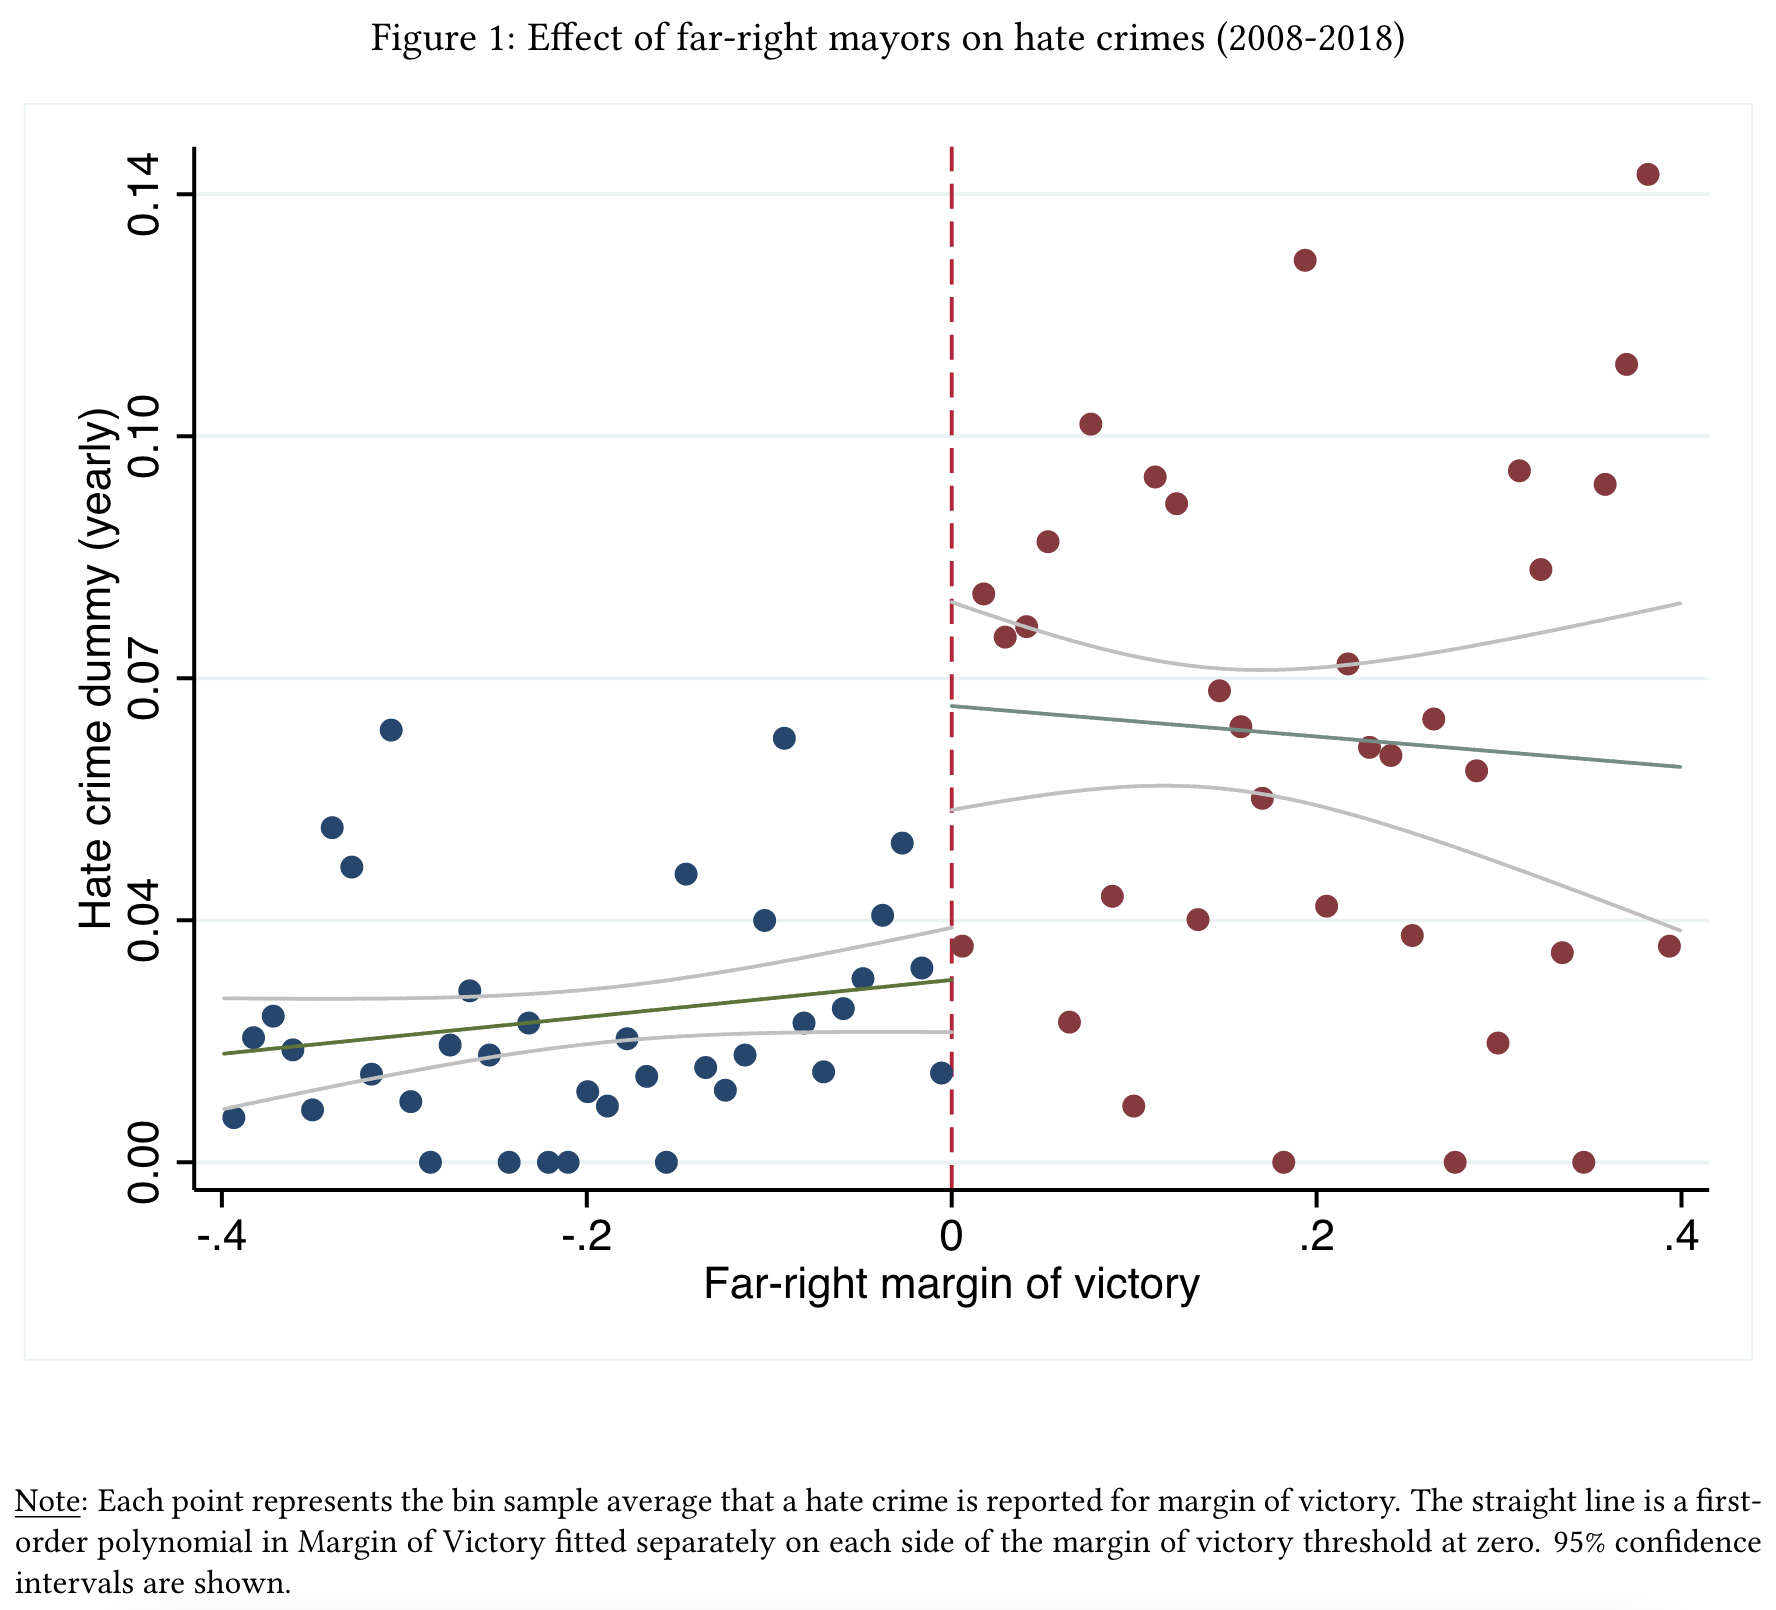 Source: Romarri (2020)
Example: Regression discontinuity design

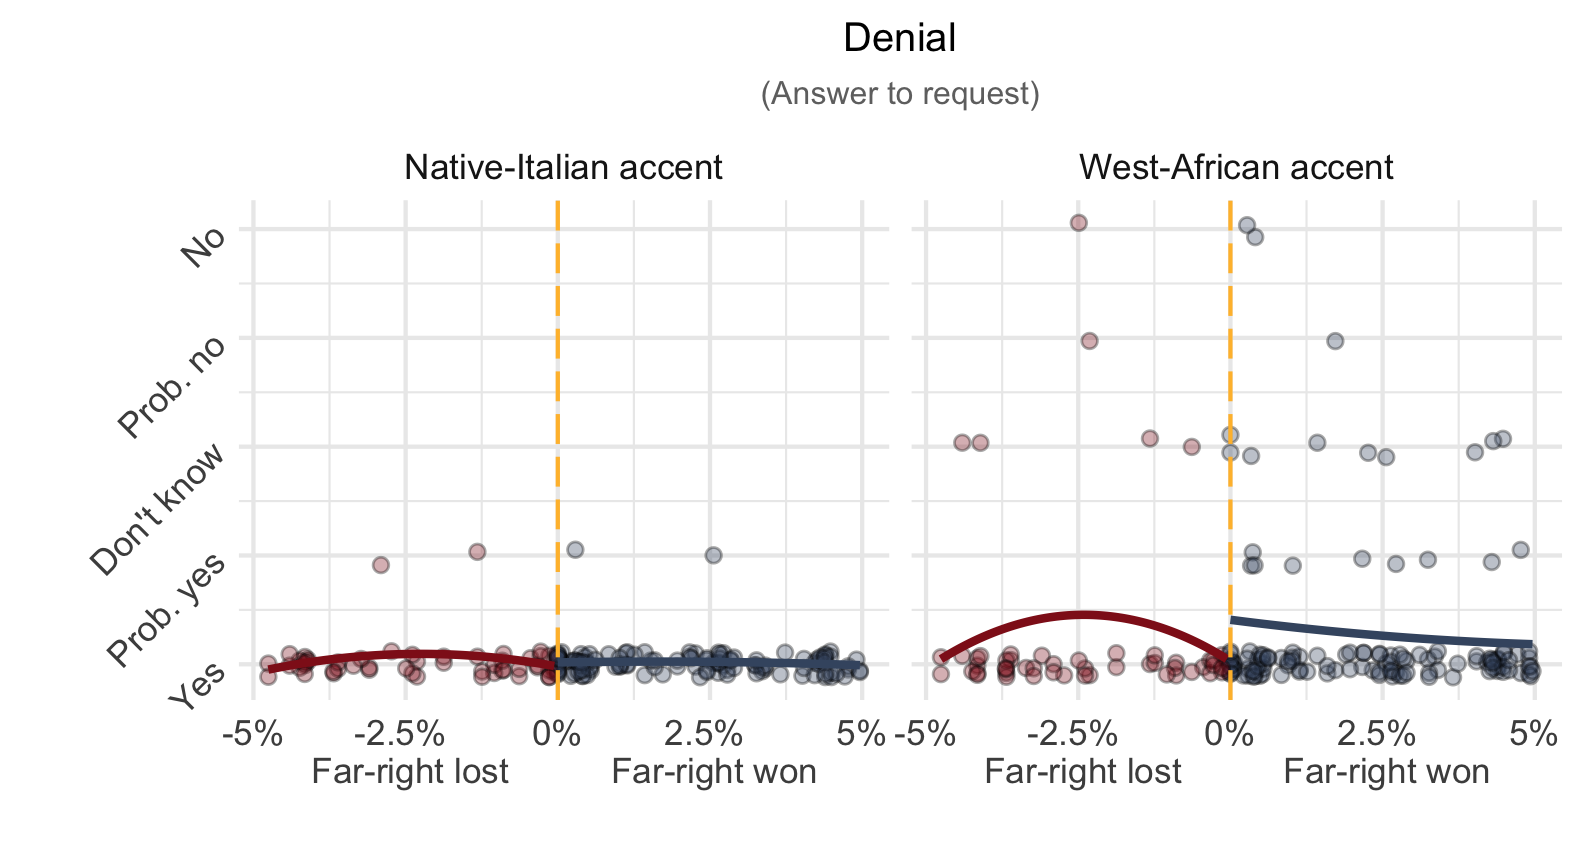 Source: Krakowski, Schaeffer, Romarri et al. (2022)
Break
Course structure

Course structure

Recommendations
Activate email notifications on Absalon.
Regularly check your KU email or forward it to your personal email.
Ask and answer questions in the t-R-ouble forum on Absalon.

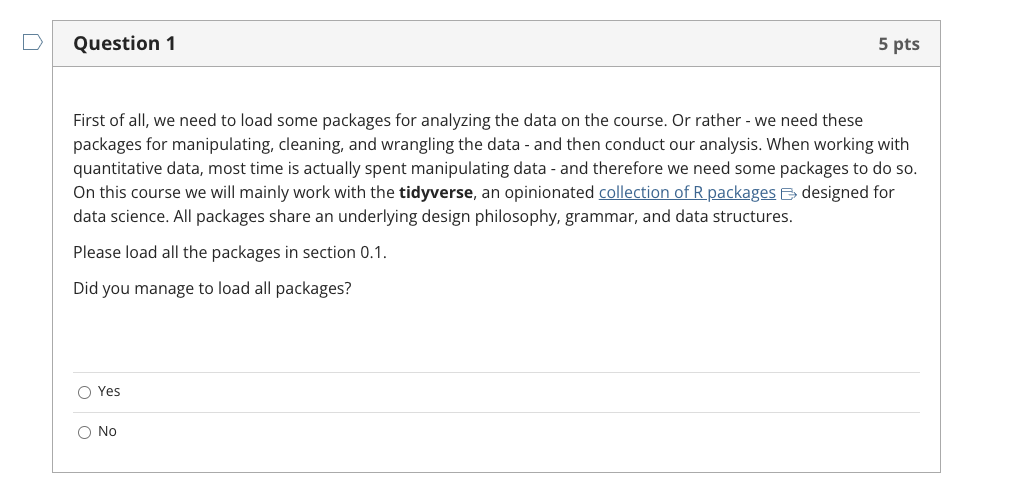
Weekly Absalon Online Quizzes
13 Online Quizzes on Absalon designed by Epinion & Adna.
Based on data Epinion collects for municipality of Copenhagen, DR, Skat, etc.
Submit at least 10 completed quizzes to qualify for the integrated exam with "Velfærd, ulighed og mobilitet"!
Submit individually and within two weeks after they are made available online (i.e., Wednesdays after the lecture).


Consequently, this course assumes
- You have basic R coding skills and know how to use RStudio.
Consequently, this course assumes
You have basic R coding skills and know how to use RStudio.
You know basic statistics:
- Descriptive statistics: %, ¯x, SD(x).
- Associations:
- Correlation: ry,x,
- OLS regression: yi=α+βxi+ϵi.
- Inference: Confidence intervals, t-values & p-values.
Two textbooks
→ Both textbooks are accessible at Academic Books and are available at the university library.
The first textbook, carried over from last semester, serves as a reference for regression and statistical inference.
Veaux, Velleman, and Bock (2021)
To deepen our understanding of how regression analysis can be applied to identify causal effects, we will heavily rely on Angrist and Pischke's textbook
Angrist and Pischke (2014)
Questions

Task 2 Open RStudio and follow these instructions
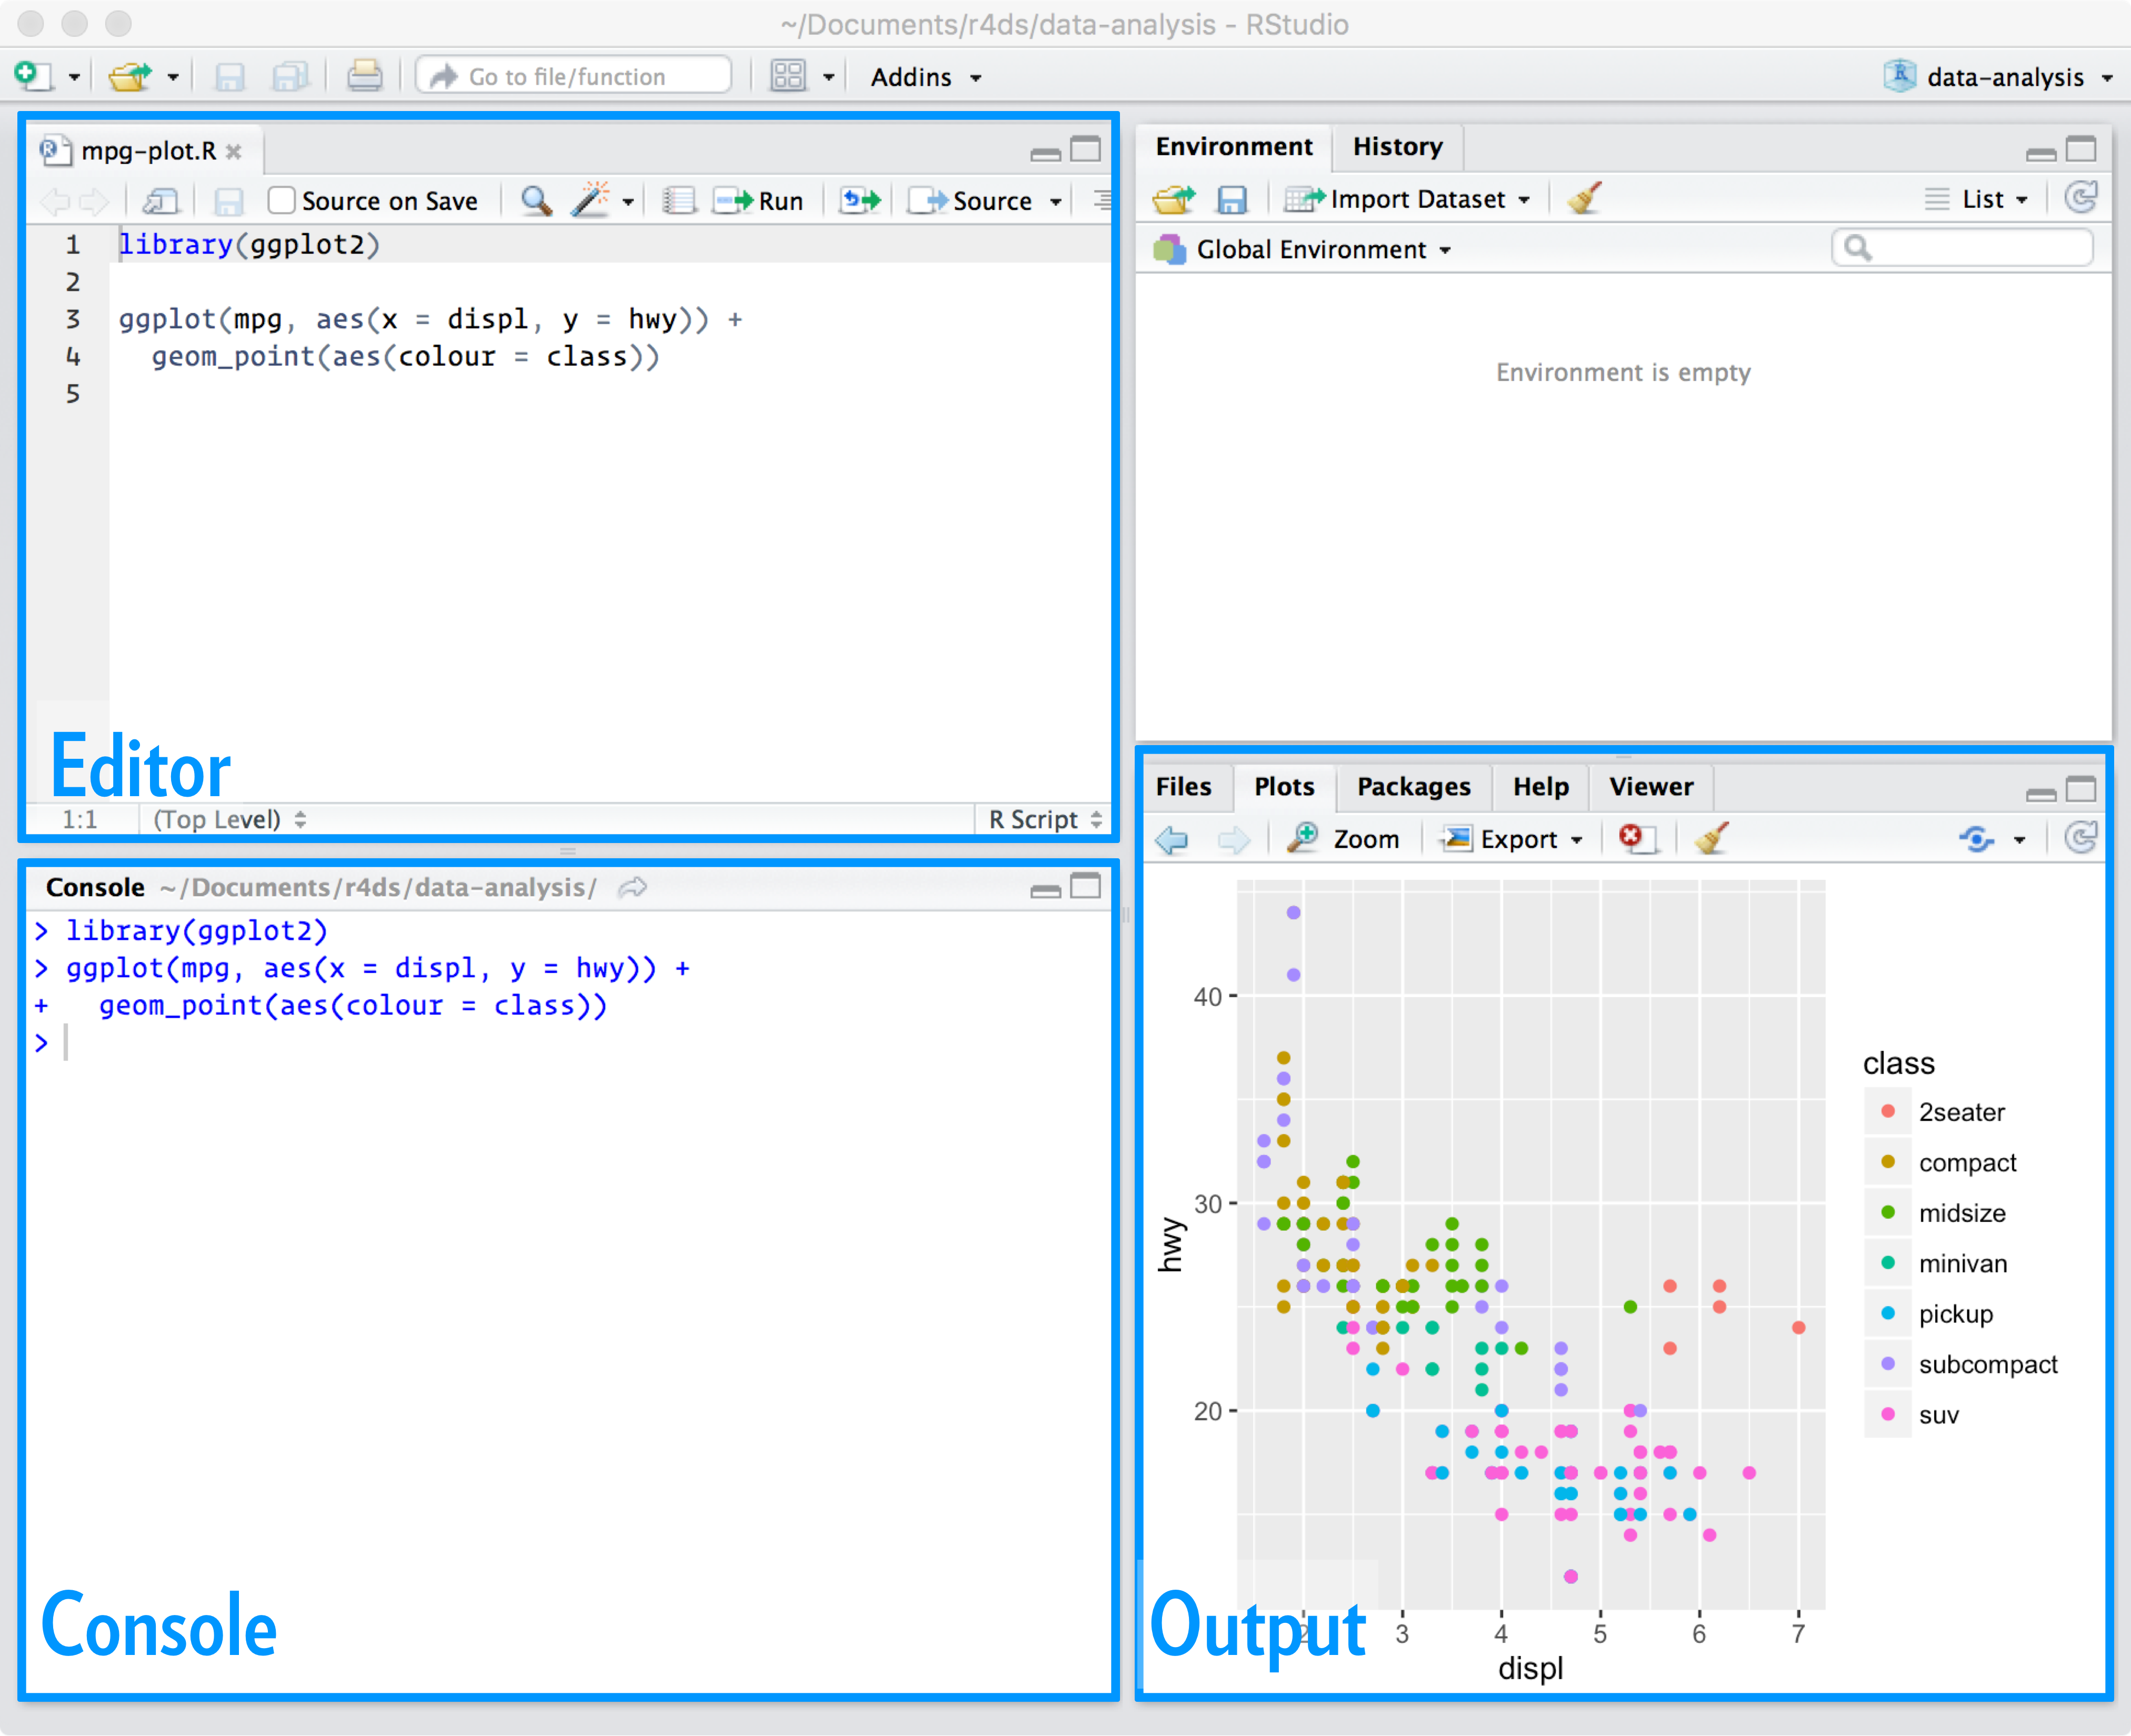
Task 3 Set R Studio preferences
Set these preferences to improve reproducibility!
→ RStudio/Tools/Global options.

R Studio workflow
Use Projects to manage all files (scripts, data, figures and tables) belonging to the same project.
Always start your RStudio session by clicking on the Project for this course.
Use the editor the write as many R scripts as you like, save them in the same folder as your Project. Thereby you can reproduce your results.

Set up your "Stats_II" project
- Click on the Project button.

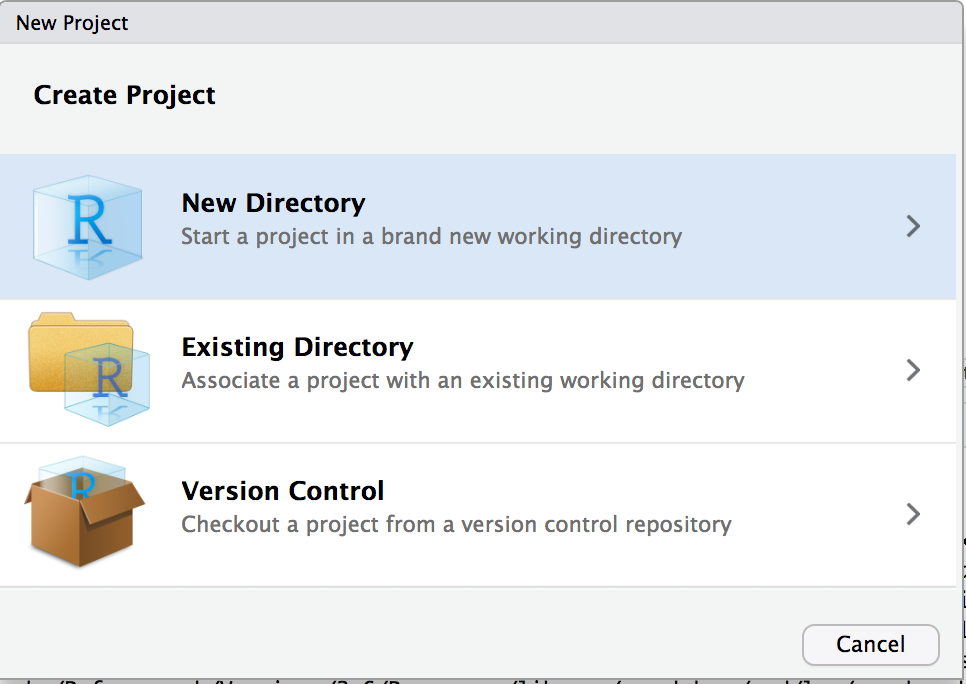
Set up your "Stats_II" project
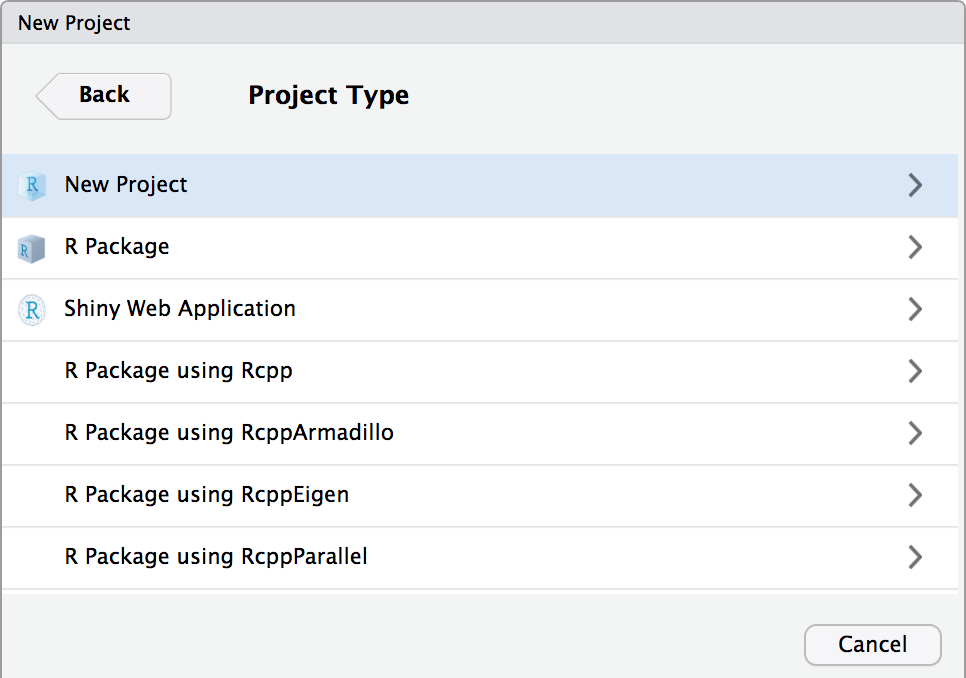
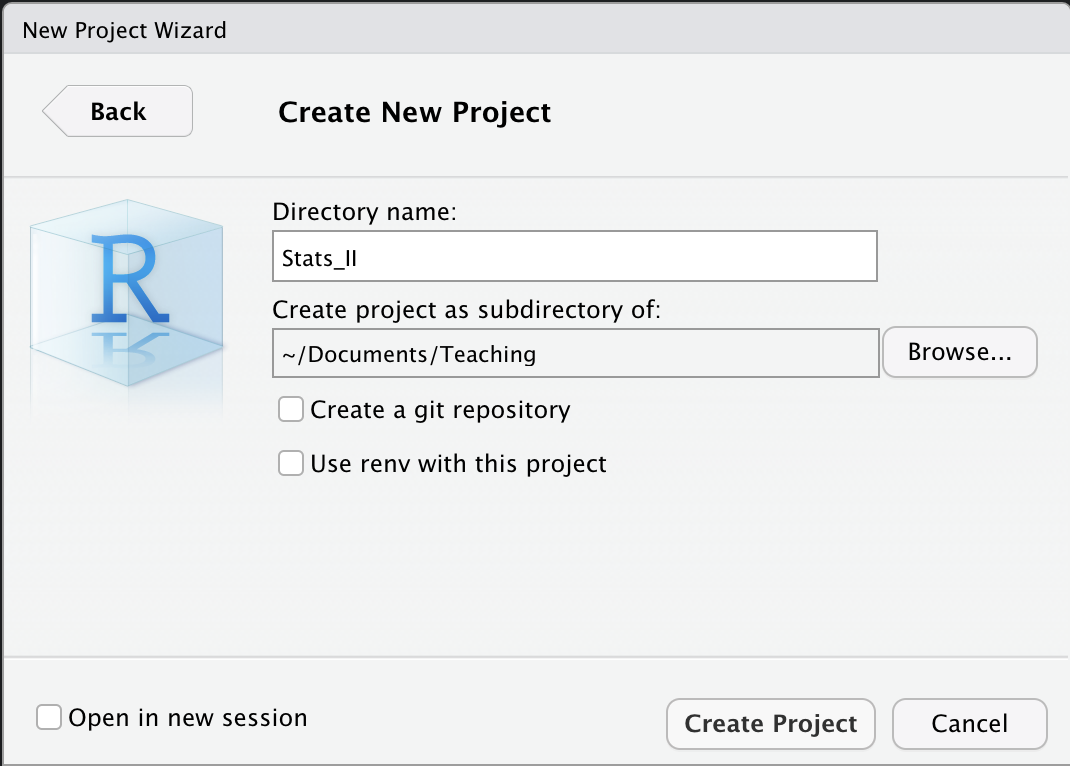
Set up a new project in R Studio.
- "New Directory"
- "New Project"
- Finally, a name for the folder and under "Browse" where you want that folder to be located. I call mine Stats_II.
- This will also generate a folder with the name you chose. Use that folder for everything related to this course.
Done! Now you should find an empty folder under the path your wanted it to be set up.
In the future, always start RStudio by double clicking on the project icon in your folder for this course.
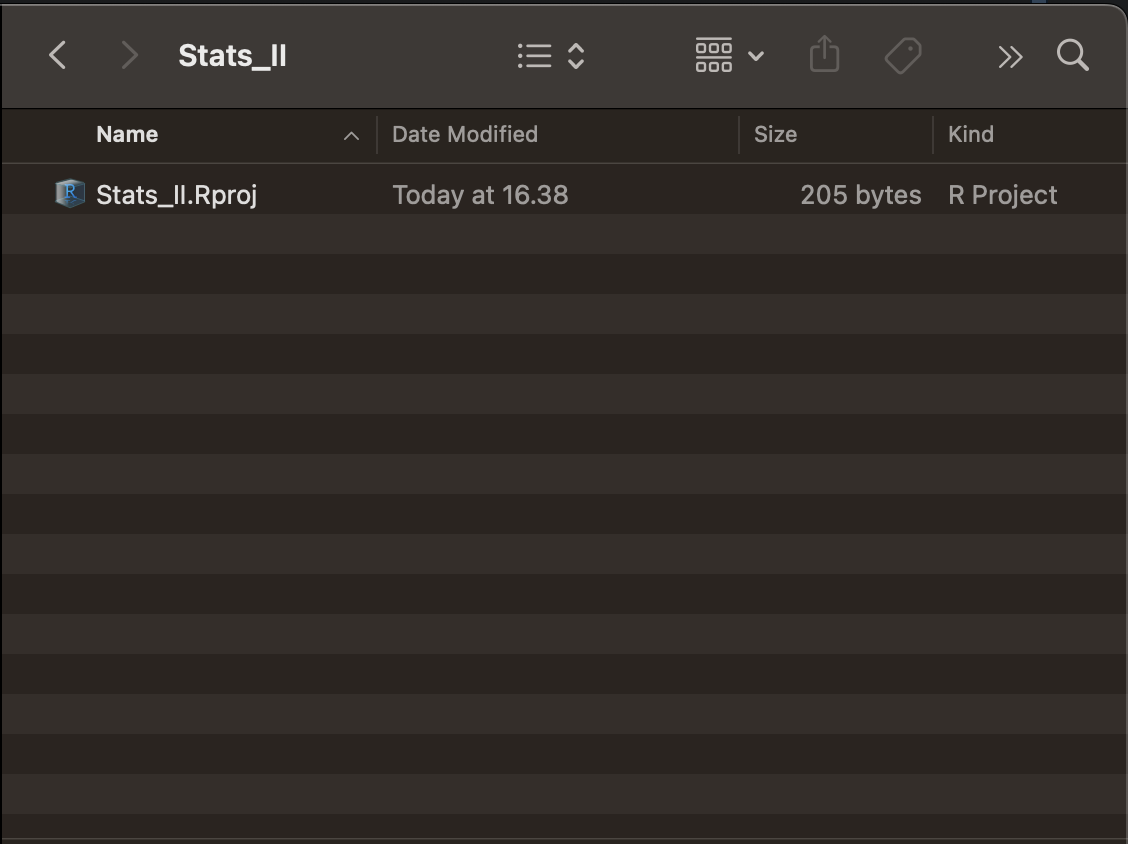
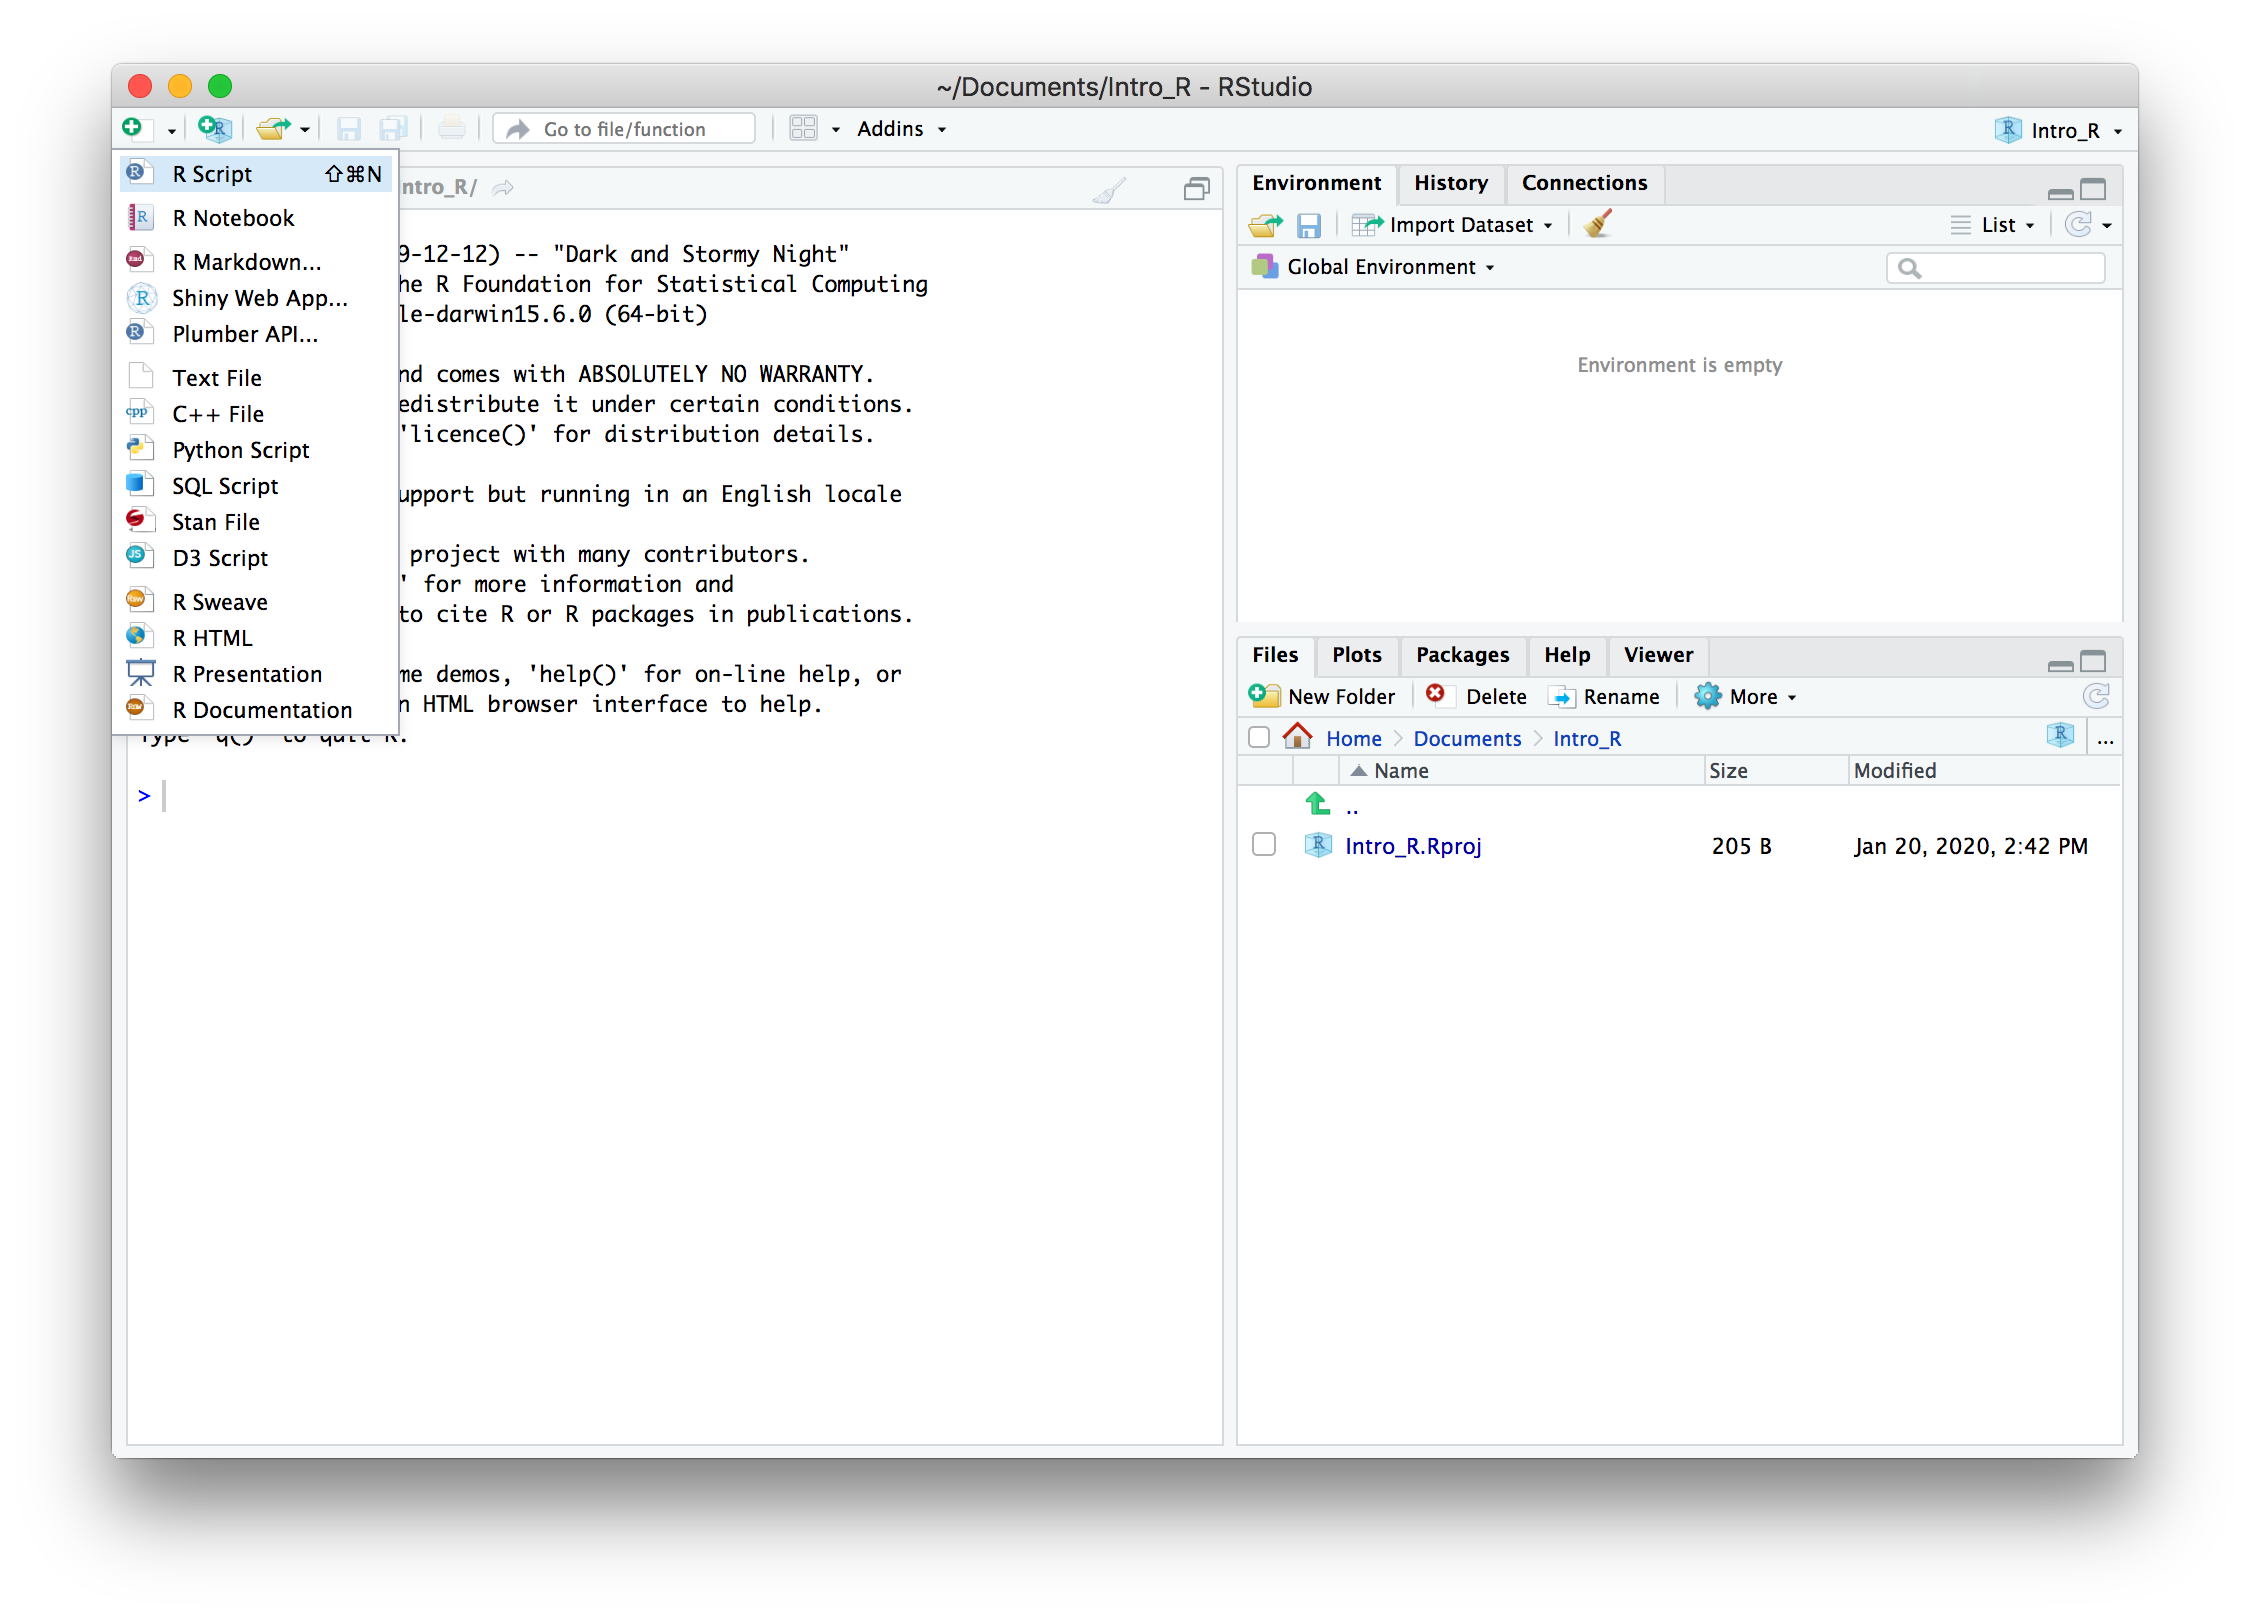
R Scripts
- Open a new R Script.
- Save it in your new folder.
- Find it under "Files".
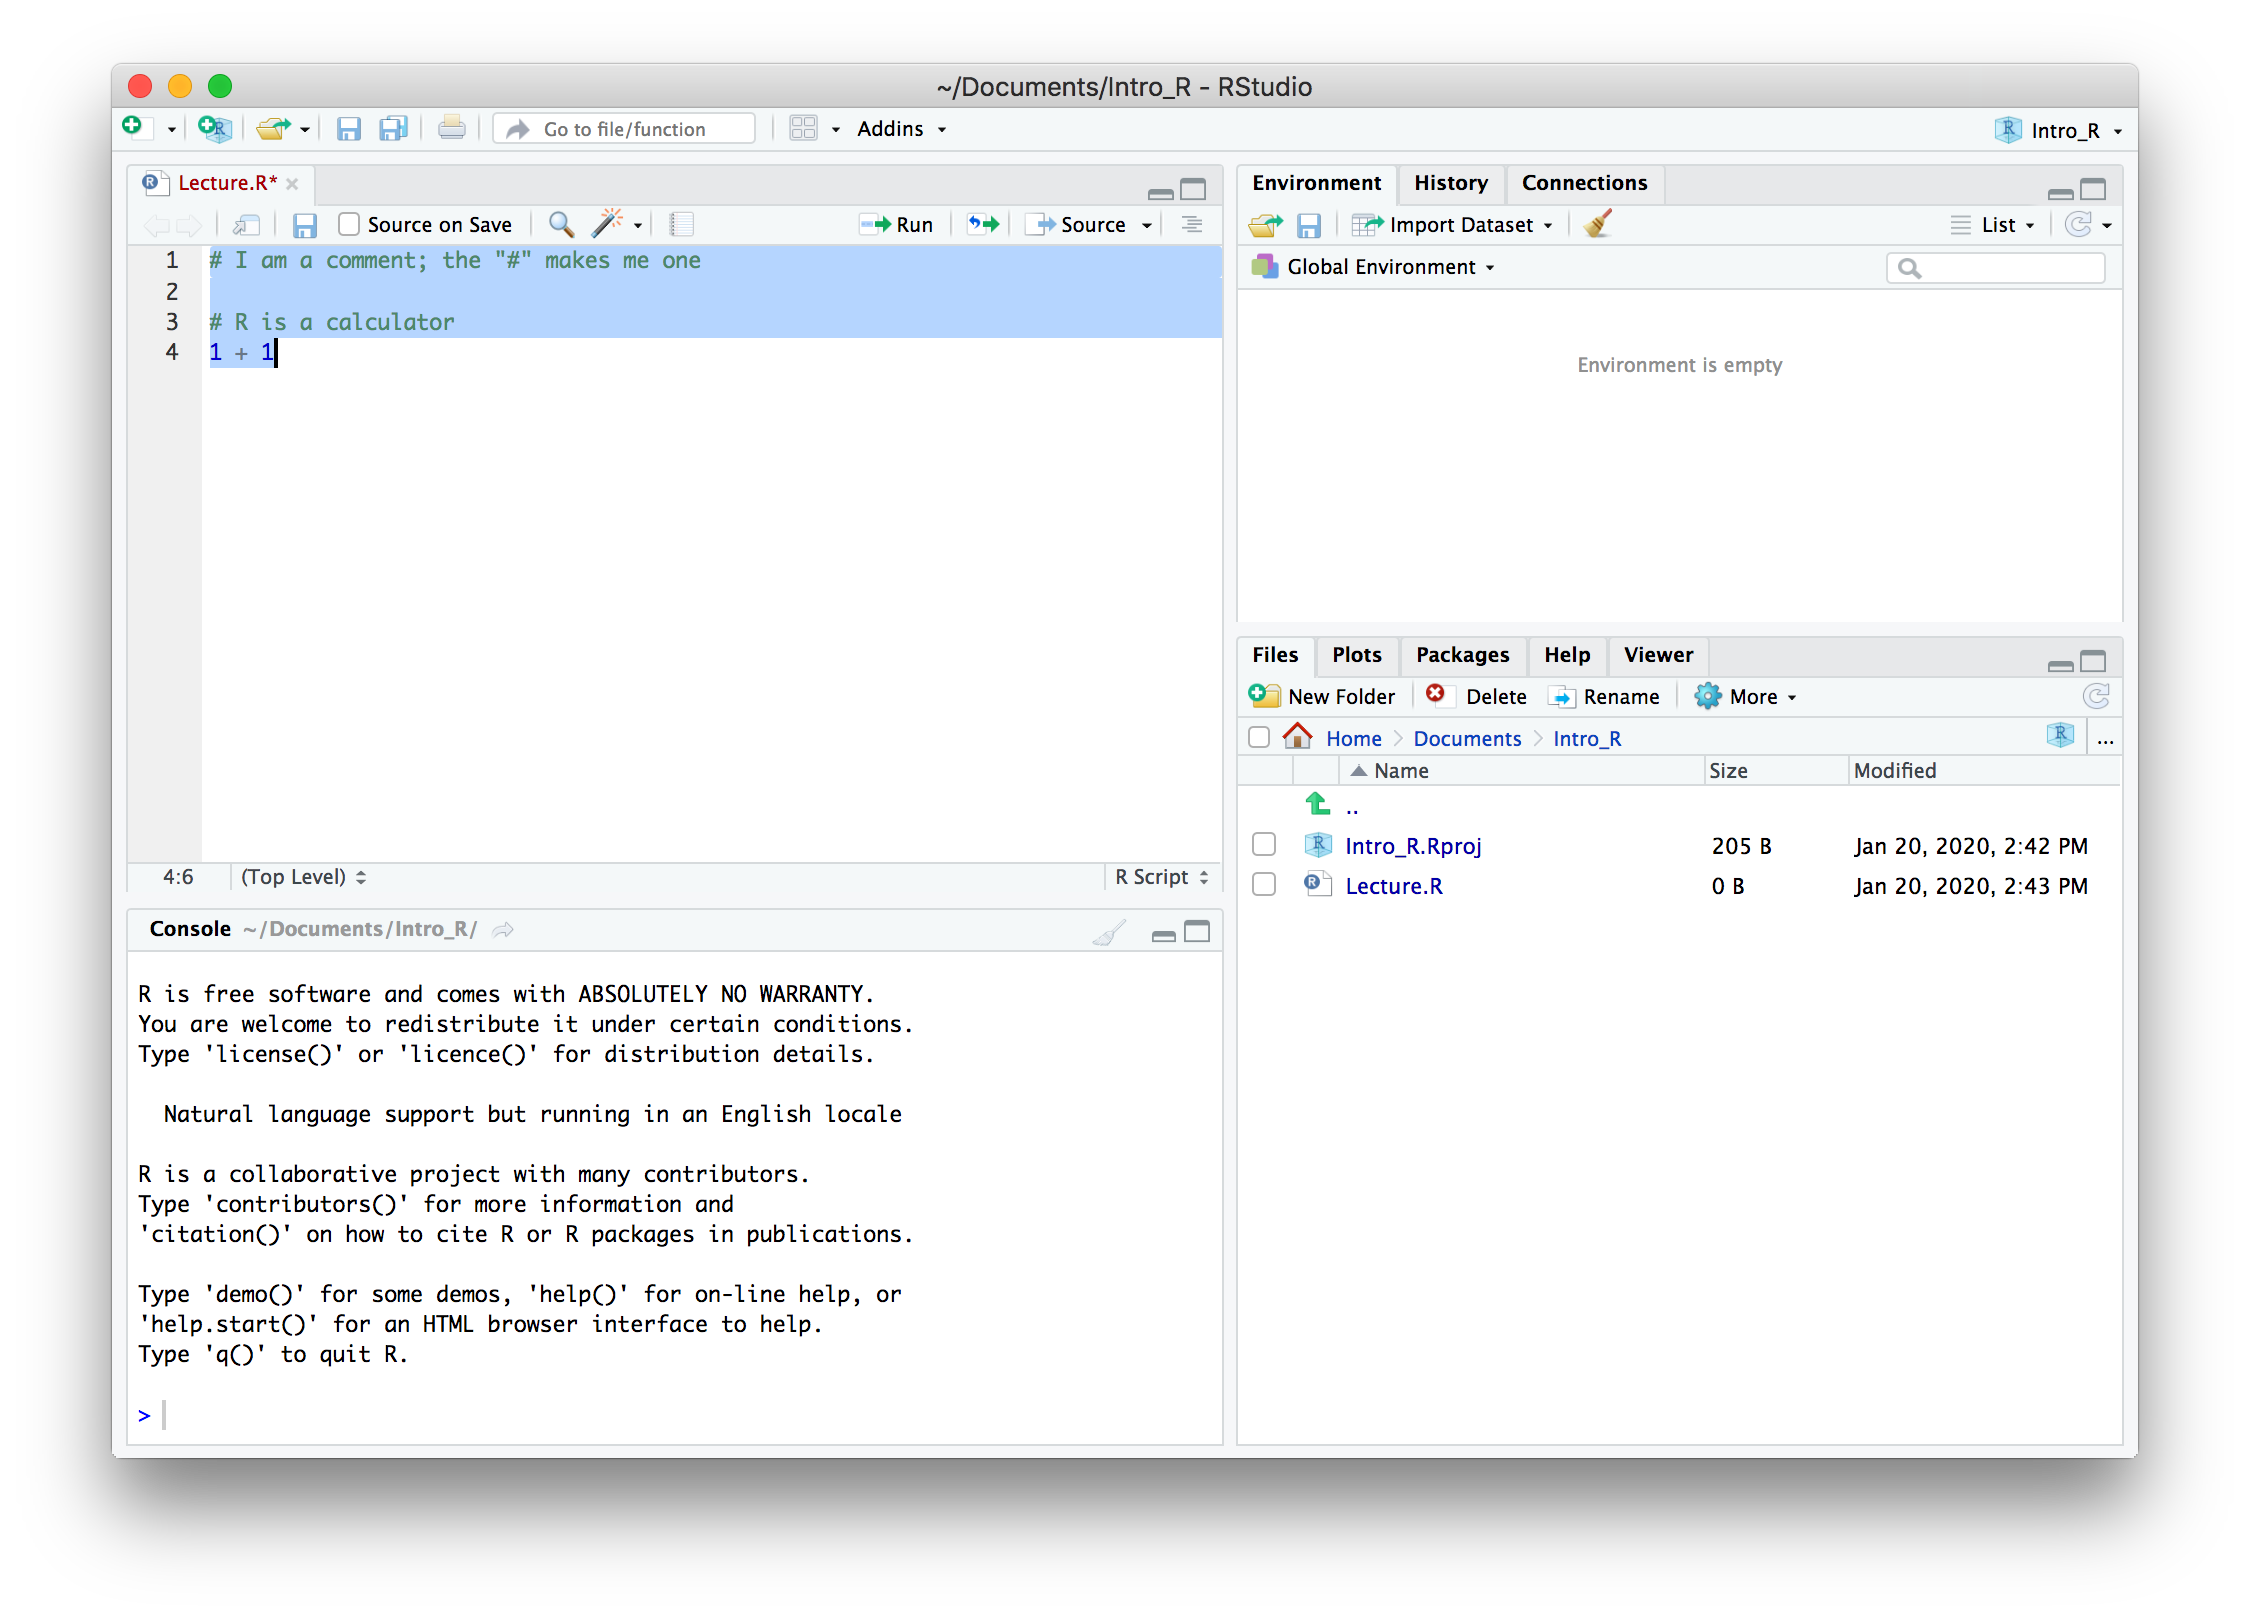
R Scripts
- Type the lines shon in the screenshot on the right.
- Save the file by clicking on the flopy disc icon;
- I called mine "Lecture.R".
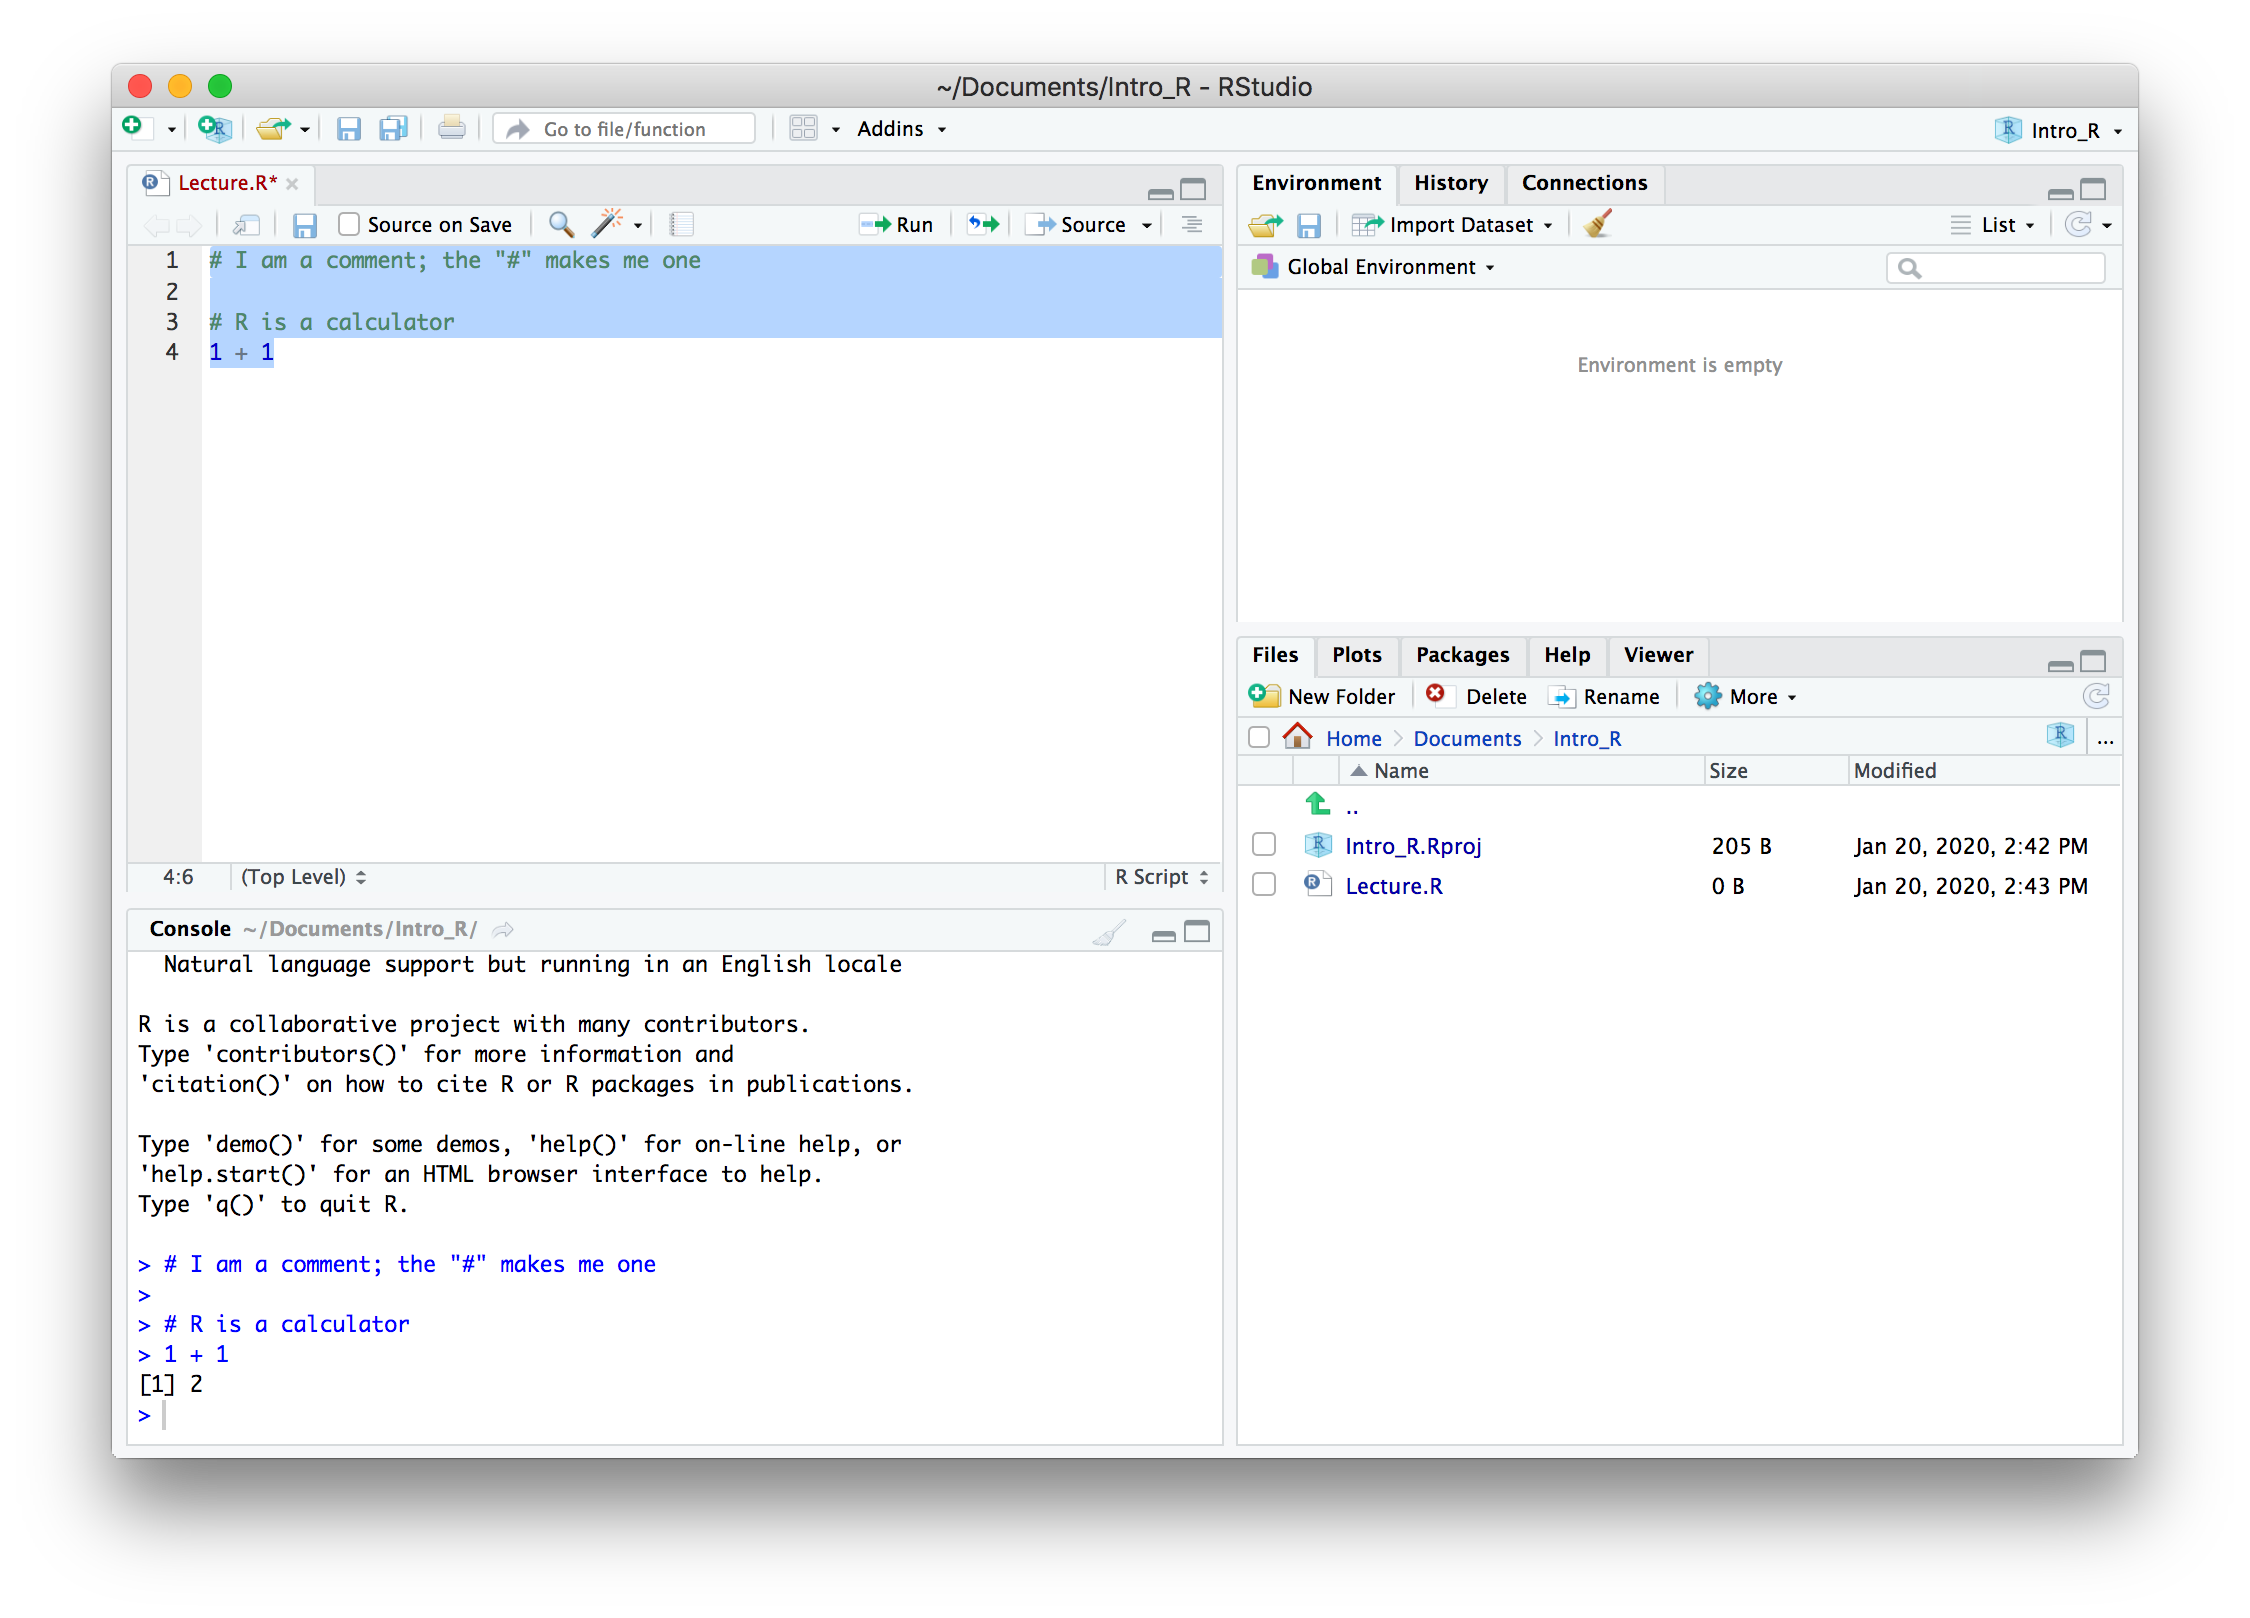
- Mark all code and click "run".
R Scripts
OK, you are good to go!
Pro tip: Use the R Script to take notes during the lecture!
A # defines a comment. So use it to take notes and code in one single document per lecture.
AI & Large Language Models like ChatGPT
- Privacy: Don't use AI/LLMs to process sensitive information!
Learning: Use AI/LLMs to explain, comment, debug, and improve R code that you drafted. Also use AI/LLMs to get summaries of text passages and concepts that you do not understand. This will help you to read complex texts and better understand difficult topics. You can also use use AI/LLMs to discuss your understanding of the course materials and ask things that confuse you.
Generation: Don't use AI/LLMs to generate, draft, and write your R code. You need to learn how to code to assess whether ChatGPT coded what you asked for.

References
Angrist, J. D. and J. Pischke (2014). Mastering 'Metrics: The Path from Cause to Effect. Princeton University Press.
Krakowski, K., M. Schaeffer, A. Romarri, et al. (2022). "Populist Right-Wing Governors, Healthcare Chauvinism, and Public Health in the Time of the Global Pandemic". In: Unpublished manuscript.
Legewie, J. and M. Schaeffer (2016). "Contested Boundaries: Explaining Where Ethnoracial Diversity Provokes Neighborhood Conflict". In: American Journal of Sociology, pp. 125-161.
Romarri, A. (2020). Do Far-Right Mayors Increase the Probability of Hate Crimes? Evidence From Italy. SSRN Scholarly Paper ID 3506811. Rochester, NY: Social Science Research Network.
Schaeffer, M. and M. Haderup Larsen (2023). "Who Should Get Vaccinated First? Limits of Solidarity during the First Week of the Danish Vaccination Programme". In: European Sociological Review, pp. 1-13.
Veaux, D., Velleman, and Bock (2021). Stats: Data and Models, Global Edition. Pearson Higher Ed.
Wiedner, J., M. Schaeffer, S. Carol, et al. (2023). "Ethno-Religious Minority Infrastructures: Why Do Some Immigrant Minorities Build Dense Organizational Infrastructures While Others Do not?" In: Unpublished manuscript.